EM.Terrano
True 3D, Coherent, Polarimetric Ray Tracer That Simulates Very Large Urban Scenes In Just Few Minutes!
Contents
- 1 Product Overview
- 2 EM.Terrano Features at a Glance
- 3 Building a Propagation Scene in EM.Terrano
- 4 EM.Terrano's Ray Domain & Global Environment
- 5 Defining Point Transmitters & Point Receivers for Your Propagation Scene
- 5.1 The Nature of Transmitters & Receivers
- 5.2 Defining a Point Transmitter Set in the Formal Way
- 5.3 Defining a Point Receiver Set in the Formal Way
- 5.4 Modulation Waveform and Detection
- 5.5 A Note on EM.Terrano's Native Dipole Radiators
- 5.6 A Note on the Rotation of Antenna Radiation Patterns
- 5.7 Adjustment of Tx/Rx Elevation above a Terrain Surface
- 6 Discretizing the Propagation Scene in EM.Terrano
- 7 Running Ray Tracing Simulations in EM.Terrano
- 7.1 Running a Single-Frequency SBR Analysis
- 7.2 Changing the SBR Engine Settings
- 7.3 Polarimetric Channel Analysis
- 7.4 The "Near Real-Time" Polarimatrix Solver
- 7.5 EM.Terrano's Simulation Modes
- 7.6 Transmitter Sweep
- 7.7 Rotational Sweep
- 7.8 Mobile Sweep
- 7.9 Investigating Propagation Effects Selectively One at a Time
- 8 Working with EM.Terrano's Simulation Data
- 9 Using EM.Terrano as an Asymptotic Field Solver
- 10 Statistical Analysis of Propagation Scene
Product Overview
EM.Terrano in a Nutshell
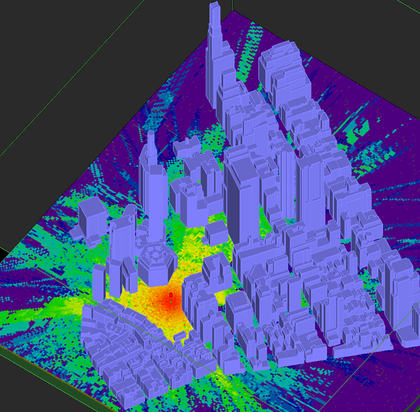
EM.Terrano is a physics-based, site-specific, wave propagation modeling tool that enables engineers to quickly determine how radio waves propagate in urban, natural or mixed environments. EM.Terrano's simulation engine is equipped with a fully polarimetric, coherent 3D ray tracing solver based on the Shooting-and-Bouncing-Rays (SBR) method, which utilizes geometrical optics (GO) in combination with uniform theory of diffraction (UTD) models of building edges. EM.Terrano lets you analyze and resolve all the rays transmitted from one ore more signal sources, which propagate in a real physical channel made up of buildings, terrain and other obstructing structures. EM.Terrano finds all the rays received by a receiver at a particular location in the physical site and computes their vectorial field and power levels, time delays, angles of arrival and departure, etc. Using EM.Terrano you can examine the connectivity of a communication link between any two points in a real specific propagation site.
Since its introduction in 2002, EM.Terrano has helped wireless engineers around the globe model the physical channel and the mechanisms by which radio signals propagate in various environments. EM.Terrano’s advanced ray tracing simulator finds the dominant propagation paths at each specific physical site. It calculates the true signal characteristics at the actual locations using physical databases of the buildings and terrain at a given site, not those of a statistically average or representative environment. The earlier versions of EM.Terrano's SBR solver relied on certain assumptions and approximations such as the vertical plane launch (VPL) method or 2.5D analysis of urban canyons with prismatic buildings using two separate vertical and horizontal polarizations. In 2014, we introduced a new fully 3D polarimetric SBR solver that accurately traces all the three X, Y and Z components of the electric fields (both amplitude and phase) at every point inside the computational domain. Using a 3D CAD modeler, you can now set up any number of buildings with arbitrary geometries, no longer limited to vertical prismatic shapes. Versatile interior wall arrangements allow indoor propagation modeling inside complex building configurations. The most significant recent development is a multicore parallelized SBR simulation engine that takes advantage of ultrafast k-d tree algorithms borrowed from the field of computer graphics and video gaming to achieve the ultimate speed and efficiency in geometrical optics ray tracing.
![]() Click here to learn more about the Basic SBR Theory.
Click here to learn more about the Basic SBR Theory.
EM.Terrano as the Propagation Module of EM.Cube
EM.Terrano is the ray tracing Propagation Module of EM.Cube, a comprehensive, integrated, modular electromagnetic modeling environment. EM.Terrano shares the visual interface, 3D parametric CAD modeler, data visualization tools, and many more utilities and features collectively known as CubeCAD with all of EM.Cube's other computational modules.
With the seamless integration of EM.Terrano with EM.Cube's other modules, you can now model complex antenna systems in EM.Tempo, EM.Libera, EM.Picasso or EM.Illumina, and generate antenna radiation patterns that can be used to model directional transmitters and receivers at the two ends of your propagation channel. Conversely, you can analyze a propagation scene in EM.Terrano, collect all the rays received at a certain receiver location and import them as coherent plane wave sources to EM.Tempo, EM.Libera, EM.Picasso or EM.Illumina.
![]() Click here to learn more about EM.Cube Modeling Environment.
Click here to learn more about EM.Cube Modeling Environment.
Advantages & Limitations of EM.Terrano's SBR Solver
EM.Terrano's SBR simulation engine utilizes an intelligent ray tracing algorithm that is based on the concept of k-dimensional trees. A k-d tree is a space-partitioning data structure for organizing points in a k-dimensional space. k-d trees are particularly useful for searches that involve multidimensional search keys such as range searches and nearest neighbor searches. In a typical large radio propagation scene, there might be a large number of rays emanating from the transmitter that may never hit any obstacles. For example, upward-looking rays in an urban propagation scene quickly exit the computational domain. Rays that hit obstacles on their path, on the other hand, generate new reflected and transmitted rays. The k-d tree algorithm traces all these rays systematically in a very fast and efficient manner. Another major advantage of k-d trees is the fast processing of multi-transmitters scenes.
EM.Terrano performs fully polarimetric and coherent SBR simulations with arbitrary transmitter antenna patterns. Its SBR simulation engine is a true asymptotic "field" solver. The amplitudes and phases of all the three vectorial field components are computed, analyzed and preserved throughout the entire ray tracing process from the source location to the field observation points. You can visualize the magnitude and phase of all six electric and magnetic field components at any point in the computational domain. In most scenes, the buildings and the ground or terrain can be assumed to be made of homogeneous materials. These are represented by their electrical properties such as permittivity εr and electric conductivity σ. More complex scenes may involve a multilayer ground or multilayer building walls. In such cases, one can no longer use the simple reflection or transmission coefficient formulas for homogeneous medium interfaces. EM.Terrano calculates the reflection and transmission coefficients of multilayer structures as functions of incident angle, frequency and polarization and uses them at the respective specular points.
It is very important to keep in mind that SBR is an asymptotic electromagnetic analysis technique that is based on Geometrical Optics (GO) and the Uniform Theory of Diffraction (UTD). It is not a "full-wave" technique, and it does not provide a direct numerical solution of Maxwell's equations. SBR makes a number of assumptions, chief among them, a very high operational frequency such that the length scales involved are much larger than the operating wavelength. Under this assumed regime, electromagnetic waves start to behave like optical rays. Virtually all the calculations in SBR are based on far field approximations. In order to maintain a high computational speed for urban propagation problems, EM.Terrano ignores double diffractions. Diffractions from edges give rise to a large number of new secondary rays. The power of diffracted rays drops much faster than reflected rays. In other words, an edge-diffracted ray does not diffract again from another edge in EM.Terrano. However, reflected and penetrated rays do get diffracted from edges just as rays emanated directly from the sources do.
EM.Terrano Features at a Glance
Scene Definition / Construction
- Buildings/blocks with arbitrary geometries and material properties
- Buildings/blocks with impenetrable surfaces or penetrable surfaces using thin wall approximation
- Multilayer walls for indoor propagation scenes
- Penetrable volume blocks with arbitrary geometries and material properties
- Import of shapefiles and STEP, IGES and STL CAD model files for scene construction
- Terrain surfaces with arbitrary geometries and material properties and random rough surface profiles
- Import of digital elevation map (DEM) terrain models
- Python-based random city wizard with randomized building locations, extents and orientations
- Python-based wizards for generation of parameterized multi-story office buildings and several terrain scene types
- Standard half-wave dipole transmitters and receivers oriented along the principal axes
- Short Hertzian dipole sources with arbitrary orientation
- Isotropic receivers or receiver grids for wireless coverage modeling
- Radiator sets with 3D directional antenna patterns (imported from other modules or external files)
- Full three-axis rotation of imported antenna patterns
- Interchangeable radiator-based definition of transmitters and receivers (networks of transceivers)
Wave Propagation Modeling
- Fully 3D polarimetric and coherent Shoot-and-Bounce-Rays (SBR) simulation engine
- GTD/UTD diffraction models for diffraction from building edges and terrain
- Triangular surface mesh generator for discretization of arbitrary block geometries
- Super-fast geometrical/optical ray tracing using advanced k-d tree algorithms
- Intelligent ray tracing with user defined angular extents and resolution
- Ray reflection, edge diffraction and ray transmission through multilayer walls and material volumes
- Communication link analysis for superheterodyne transmitters and receivers
- 17 digital modulation waveforms for the calculation of Eb/N0 and Bit error rate (BER)
- Incredibly fast frequency sweeps of the entire propagation scene in a single SBR simulation run
- Parametric sweeps of scene elements like building properties, or radiator heights and rotation angles
- Statistical analysis of the propagation scene
- Polarimetric channel characterization for MIMO analysis
- "Almost real-time" Polarimatrix solver using an existing ray database
- "Almost real-time" transmitter sweep using the Polarimatrix solver
- "Almost real-time" rotational sweep for modeling beam steering using the Polarimatrix solver
- "Almost real-time" mobile sweep for modeling mobile communications between Tx-Rx pairs along a mobile path using the Polarimatrix solver
Data Generation & Visualization
- Standard output parameters for received power, path loss, SNR, Eb/N0 and BER at each individual receiver
- Graphical visualization of propagating rays in the scene
- Received power coverage maps
- Link connectivity maps (based on minimum required SNR and BER)
- Color-coded intensity plots of polarimetric electric field distributions
- Incoming ray data analysis at each receiver including delay, angles of arrival and departure
- Cartesian plots of path loss along defined paths
- Power delay profile of the selected receiver
- Polar stem charts of angles of arrival and departure of the selected receiver
Building a Propagation Scene in EM.Terrano
The Various Elements of a Propagation Scene
A typical propagation scene in EM.Terrano consists of several elements. At a minimum, you need a transmitter (Tx) at some location to launch rays into the scene and a receiver (Rx) at another location to receive and collect the incoming rays. A transmitter and a receiver together make the simplest propagation scene, representing a free-space line-of-sight (LOS) channel. In EM.Terrano, a transmitter represents a point source, while a receiver represents a point observable. Both a transmitter and a receiver are associated with point objects, which are one of the many types of geometric objects you can draw in the project workspace. Your scene might involve more than one transmitter and possibly a large grid of receivers.
A more complicated propagation scene usually contains several buildings, walls, or other kinds of scatterers and wave obstructing objects. You model all of these elements by drawing geometric objects in the project workspace or by importing external CAD models. EM.Terrano does not organize the geometric objects of your project workspace by their material composition. Rather, it groups the geometric objects into blocks based on a common type of interaction with incident rays. EM.Terrano offer the following types of object blocks:
| Icon | Block/Group Type | Ray Interaction Type | Object Types Allowed | Notes |
|---|---|---|---|---|
| |
Impenetrable Surface | Ray reflection, ray diffraction | All solid & surface geometric objects, no curve objects | Basic building group for outdoor scenes |
| |
Penetrable Surface | Ray reflection, ray diffraction, ray transmission in free space | All solid & surface geometric objects, no curve objects | Behaves similar to impenetrable surface and uses thin wall approximation for generating transmitted rays, used to model hollow buildings with ray penetration, entry and exit |
| |
Terrain Surface | Ray reflection, ray diffraction | All surface geometric objects, no solid or curve objects | Behaves exactly like impenetrable surface but can change the elevation of all the buildings and transmitters and receivers located above it |
| |
Penetrable Volume | Ray reflection, ray diffraction, ray transmission and ray attenuation inside homogeneous material media | All solid geometric objects, no surface or curve objects | Used to model wave propagation inside a volumetric material block, also used for creating individual solid walls and interior building partitions and panels in indoor scenes |
| |
Base Location Set | Either ray generation or ray reception | Only point objects | Required for the definition of transmitters and receivers |
| |
Point Scatterer Set | Ray reception and ray scattering | Only point, box and sphere objects | Required for the definition of point scatterers as targets in a radar simulation |
| |
Virtual Object | No ray interaction | All types of objects | Used for representing non-physical items |
Click on each type to learn more about it in the Glossary of EM.Cube's Materials, Sources, Devices & Other Physical Object Types.
Impenetrable surfaces, penetrable surfaces, terrain surfaces and penetrable volumes represent all the objects that obstruct the propagation of electromagnetic waves (rays) in the free space. What differentiates them is the types of physical phenomena that are used to model their interaction with the impinging rays. EM.Terrano discretizes geometric objects into a number of flat facets. The field intensity, phase and power of the reflected and transmitted rays depend on the material properties of the obstructing facet. The specular surface of a facet can be modeled locally as a simple homogeneous dielectric half-space or as a multilayer medium. In that respect, all the obstructing objects such as buildings, walls, terrain, etc. behave in a similar way:
- They terminate an impinging ray and replace it with one or more new rays.
- They represent a specular interface between two media of different material compositions for calculating the reflection, transmission or diffraction coefficients.
An outdoor propagation scene typically involves several buildings modeled by impenetrable surfaces. Rays hit the facets of impenetrable buildings and bounce back, but they do not penetrate the object. It is assumed that the interior of such buildings are highly dissipative due to wave absorption or diffusion. An indoor propagation scene typically involves several walls, a ceiling and a floor arranged according to a certain building layout. Penetrable surfaces are used to model the exterior and interior walls of buildings. Rays reflect off these surfaces and diffract off their edges. They also penetrate the thin surface and continue their path in the free space on the other side of the wall. Terrain surfaces with irregular shapes or possibly random rough surfaces are used as an alternative to the flat global ground. You can also build mixed scenes involving both impenetrable and penetrable blocks or irregular terrain. In the context of a propagation scene, penetrable volumes are often used to model block of rain, fog or vegetation. Base location sets are used to geometrically represent point transmitters and point receivers in the project workspace.
Sometimes it is helpful to draw graphical objects as visual clues in the project workspace. These non-physical objects must belong to a virtual object group. Virtual objects are not discretized by EM.Terrano's mesh generator, and they are not passed onto the input data files of the SBR simulation engine.
Organizing the Propagation Scene by Block Groups
In EM.Terrano, all the geometric objects associated with the various scene elements like buildings, terrain surfaces and base location points are grouped together as blocks based on their common type. All the objects listed under a particular group in the navigation tree share the same color, texture and material properties. Once a new block group has been created in the navigation tree, it becomes the "Active" group of the project workspace, which is always displayed in bold letters. You can draw new objects under the active node. Any block group can be made active by right-clicking on its name in the navigation tree and selecting the Activate item of the contextual menu.
It is recommended that you first create block groups, and then draw new objects under the active block group. However, if you start a new EM.Terrano project from scratch, and start drawing a new object without having previously defined any block groups, a new default impenetrable surface group is created and added to the navigation tree to hold your new CAD object. You can always change the properties of a block group later by accessing its property dialog from the contextual menu. You can also delete a block group with all of its objects at any time.
| |
You can only import external CAD models (STEP, IGES, STL, DEM, etc.) only to the CubeCAD module. You can then transfer the imported objects from CubeCAD to EM.Terrano. |
Moving Objects Among Different Block Groups
You can move any geometric object or a selection of objects from one block group to another. You can also transfer objects among EM.Cube's different modules. For example, you often need to move imported CAD models of terrain or buildings from CubeCAD to EM.Terrano. To transfer objects, first select them in the project workspace or select their names in the navigation tree. Then right-click on them and select Move To → Module Name → Object Group from the contextual menu. For example, if you want to move a selected object to a block group called "Terrain_1" in EM.Terrano, then you have to select the menu item Move To → EM.Terrano → Terrain_1 as shown in the figure below. Note that you can transfer several objects altogether using the keyboards's Ctrl or Shift keys to make multiple selections.
Adjustment of Block Elevation on Underlying Terrain Surfaces
In EM.Terrano, buildings and all other geometric objects are initially drawn on the XY plane. In other words, the Z-coordinates of the local coordinate system (LCS) of all blocks are set to zero until you change them. Since the global ground is located a z = 0, your buildings are seated on the ground. When your propagation scene has an irregular terrain, you would want to place your buildings on the surface of the terrain and not buried under it. This can be done automatically as part of the definition of the block group. Open the property dialog of a block group and check the box labeled Adjust Block to Terrain Elevation. All the objects belonging to that block are automatically elevated in the Z direction such that their bases sit on the surface of their underlying terrain. In effect, the LCS of each of these individual objects is translated along the global Z-axis by the amount of the Z-elevation of the terrain object at the location of the LCS.
EM.Terrano's Ray Domain & Global Environment
Why Do You Need a Finite Computational Domain?
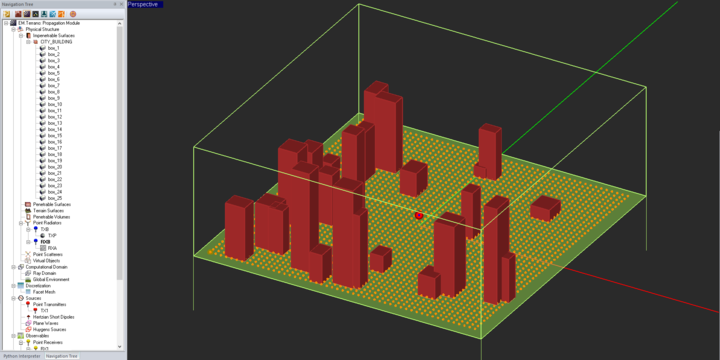
The SBR simulation engine requires a finite computational domain for ray termination. All the stray rays that emanate from a source inside this finite domain and hit its boundaries are terminated during the simulation process. Such rays exit the computational domain and travel to the infinity, with no chance of ever reaching any receiver in the scene. When you define a propagation scene with various elements like buildings, walls, terrain, etc., a dynamic domain is automatically established and displayed as a green wireframe box that surrounds the entire scene. Every time you create a new object, the domain box is automatically adjusted and extended to enclose all the objects in the scene.
To change the ray domain settings, follow the procedure below:
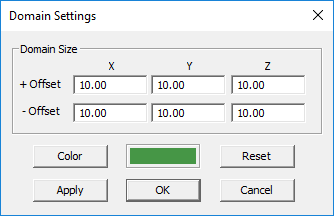
- Open the Ray Domain Settings Dialog by clicking the Domain
 button of the Simulate Toolbar, or by selecting Menu > Simulate > Computational Domain > Settings..., or by right-clicking on the Ray Domain item of the navigation tree and selecting Domain Settings... from the contextual menu, or simply using the keyboard shortcut Ctrl+A.
- The size of the Ray domain is specified in terms of six Offset parameters along the ±X, ±Y and ±Z directions. The default value of all these six offset parameters is 10 project units. Change these values as you like.
- You can also change the color of the domain box using the Color button.
- After changing the settings, use the Apply button to make the changes effective while the dialog is still open.
Understanding the Global Ground
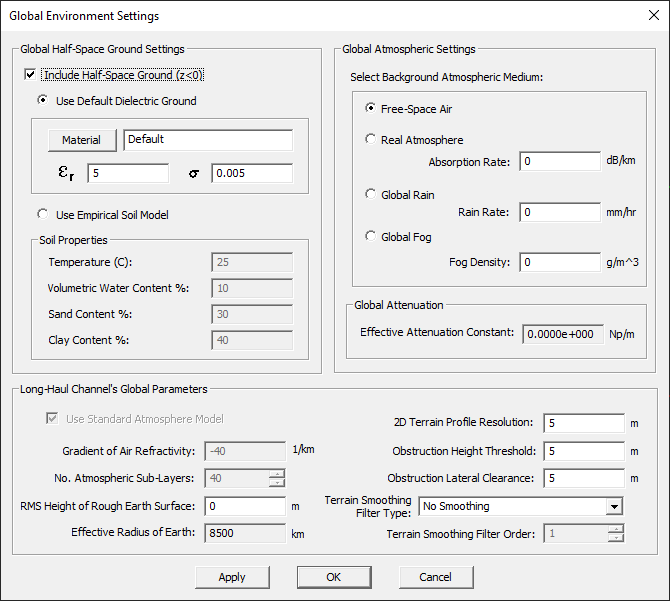
Most outdoor and indoor propagation scenes include a flat ground at their bottom, which bounces incident rays back into the scene. EM.Terrano provides a global flat ground at z = 0. The global ground indeed acts as an impenetrable surface that blocks the entire computational domain from the z = 0 plane downward. It is displayed as a translucent green plane at z = 0 extending downward. The color of the ground plane is always the same as the color of the ray domain. The global ground is assumed to be made of a homogeneous dielectric material with a specified permittivity εr and electric conductivity σ. By default, a rocky ground is assumed with εr = 5 and σ = 0.005 S/m. You can remove the global ground, in which case, you will have a free space scene. To disable the global ground, open up the "Global Ground Settings" dialog, which can be accessed by right clicking on the Global Ground item in the Navigation Tree and selecting Global Ground Settings... Remove the check mark from the box labeled "Include Half-Space Ground (z<0)" to disable the global ground. This will also remove the green translucent plane from the bottom of your scene. You can also change the material properties of the global ground and set new values for the permittivity and electric conductivity of the impenetrable, half-space, dielectric medium.
Alternatively, you can use EM.Terrano's Empirical Soil Model to define the material properties of the global ground. This model requires a number of parameters: Temperature in °C, and Volumetric Water Content, Sand Content and Clay Content all as percentage.
| |
To model a free-space propagation scene, you have to disable EM.Terrano's default global ground. |
Defining Point Transmitters & Point Receivers for Your Propagation Scene
The Nature of Transmitters & Receivers
In EM.Terrano, transmitters and receivers are indeed point radiators used for transmitting and receiving signals at different locations of the propagation scene. From a geometric point of view, both transmitters and receivers are represented by point objects or point arrays. These are grouped as base locations in the "Physical Structure" section of the navigation tree. As radiators, transmitters and receivers are defined by a radiator type with a certain far-field radiation pattern. Consistent with EM.Cube's other computational modules, transmitters are categorizes as an excitation source, while receivers are categorized as a project observable. In other words, a transmitter is used to generate electromagnetic waves that propagate in the physical scene. A receiver, on the other hand, is used to compute the received fields and received signal power or signal-to-noise ratio (SNR). For this reason, transmitters are defined and listed under the "Sources" sections of the navigation tree, while receivers are defined and listed under the "Observables" section.
EM.Terrano provides three radiator types for point transmitter sets:
- Half-wave dipole oriented along one of the three principal axes
- Two collocated, orthogonally polarized, isotropic radiators
- User defined (arbitrary) antenna with imported far-field radiation pattern
EM.Terrano also provides three radiator types for point receiver sets:
- Half-wave dipole oriented along one of the three principal axes
- Polarization-matched isotropic radiator
- User defined (arbitrary) antenna with imported far-field radiation pattern
The default transmitter and receiver radiator types are both vertical (Z-directed) half-wave dipoles.
There are three different ways to define a transmitter set or a receiver set:
- By defining point objects or point arrays under physical base location sets in the navigation tree and then associating them with a transmitter or receiver set
- Using Python commands emag_tx, emag_rx, emag_tx_array, emag_rx_array, emag_tx_line and emag_rx_line
- Using the "Basic Link" wizard
Defining a Point Transmitter Set in the Formal Way
Transmitters act as sources in a propagation scene. A transmitter is a point radiator with a fully polarimetric radiation pattern defined over the entire 3D space in the standard spherical coordinate system. EM.Terrano gives you three options for the radiator associated with a point transmitter:
- Half-wave dipole
- Orthogonally polarized isotropic radiators
- User defined antenna pattern
By default, EM.Terrano assumes that your transmitter is a vertically polarized (Z-directed) resonant half-wave dipole antenna. This antenna has an almost omni-directional radiation pattern in all azimuth directions. It also has radiation nulls along the axis of the dipole. You can change the direction of the dipole and orient it along the X or Y axes using the provided drop-down list. The second choice of two orthogonally polarized isotropic radiators is an abstract source that is used for polarimetric channel characterization as will be discussed later.
You can override the default radiator option and select any other kind of antenna with a more complicated radiation pattern. For this purpose, you have to import a radiation pattern data file to EM.Terrano. You can model any radiating structure using EM.Cube's other computational modules, EM.Tempo, EM.Picasso, EM.Libera or EM.Illumina, and generate a 3D radiation pattern data file for it. The far-field radiation patter data are stored in a specially formatted file with a ".RAD" file extension. This file contains columns of spherical φ and θ angles as well as the real and imaginary parts of the complex-valued far-zone electric field components Eθ and Eφ. The θ- and φ-components of the far-zone electric field determine the polarization of the transmitting radiator.
| |
By default, EM.Terrano assumes a vertical half-wave dipole radiator for your point transmitter set. |
A transmitter set always needs to be associated with an existing base location set with one or more point objects in the project workspace. Therefore, you cannot define a transmitter for your scene before drawing a point object under a base location set.
![]() Click here to learn how to define a Point Transmitter Set.
Click here to learn how to define a Point Transmitter Set.
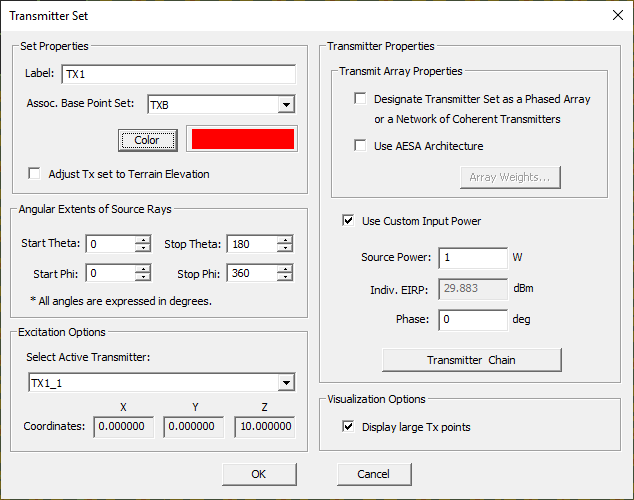
Once you define a new transmitter set, its name is added in the Transmitters section of the navigation tree. The color of all the base points associated with the newly defined transmitter set changes, and an additional little ball with the transmitter color (red by default) appears at the location of each associated base point. You can open the property dialog of the transmitter set and modify a number of parameters including the Source Power in Watts and the broadcast signal Phase in degrees. The default transmitter power level is 1W or 30dBm. There is also a check box labeled Use Custom Input Power, which is checked by default. In that case, the power and phase boxes are enabled and you can change the default 1W power and 0° phase values as you wish. EM.Cube's ".RAD" radiation pattern files usually contain the value of "Total Radiated Power" in their file header. This quantity is calculated based on the particular excitation mechanism that was used to generate the pattern file in the original EM.Cube module. When the "Use Custom Input Power" check box is unchecked, EM.Terrano will use the total radiated power value of the radiation file for the SBR simulation.
| |
In order to modify any of the transmitter set's parameters, first you need to select the "User Defined Antenna" option, even if you want to keep the vertical half-wave dipole as your radiator. |
Your transmitter in EM.Teranno is indeed more sophisticated than a simple radiator. It consists of a basic "Transmitter Chain" that contains a voltage source with a series source resistance, and connected via a segment of transmission line to a transmit antenna, which is used to launch the broadcast signal into the free space. The transmitter's property dialog allows you to define the basic transmitter chain. Click the Transmitter Chain button of the Transmitter Set dialog to open the transmitter chain dialog. As shown in the figure below, you can specify the characteristics of the baseband/IF amplifier, mixer and power amplifier (PA) including stage gains and impedance mismatch factors (IMF) as well as the characteristics of the transmission line segment that connects the PA to the antenna. Note that the transmit antenna characteristics are automatically filled using the contents of the imported radiation pattern data file. The transmitter Chain dialog also calculates and reports the "Total Transmitter Chain Gain" based on your input. When you close this dialog and return to the Transmitter Set dialog, you will see the calculated value of the Effective Isotropic Radiated Power (EIRP) of your transmitter in dBm.
Defining a Point Receiver Set in the Formal Way
Receivers act as observables in a propagation scene. The objective of a SBR simulation is to calculate the far-zone electric fields and the total received power at the location of a receiver. You need to define at least one receiver in the scene before you can run a SBR simulation. Similar to a transmitter, a receiver is a point radiator, too. EM.Terrano gives you three options for the radiator associated with a point receiver set:
- Half-wave dipole
- Polarization matched isotropic radiator
- User defined antenna pattern
By default, EM.Terrano assumes that your receiver is a vertically polarized (Z-directed) resonant half-wave dipole antenna. You can change the direction of the dipole and orient it along the X or Y axes using the provided drop-down list. An isotropic radiator has a perfect omni-directional radiation pattern in all azimuth and elevation directions. An isotropic radiator doesn't exist physically in the real world, but it can be used simply as a point in space to compute the electric field.
You may also define a complicated radiation pattern for your receiver set. In that case, you need to import a radiation pattern data file to EM.Terrano similar to the case of a transmitter set.
| |
By default, EM.Terrano assumes a vertical half-wave dipole radiator for your point receiver set. |
Similar to transmitter sets, you define a receiver set by associating it with an existing base location set with one or more point objects in the project workspace. All the receivers belonging to the same receiver set have the same radiator type. A typical propagation scene contains one or few transmitters but usually a large number of receivers. To generate a wireless coverage map, you need to define an array of points as your base location set.
![]() Click here to learn how to define a Point Receiver Set.
Click here to learn how to define a Point Receiver Set.
Once you define a new receiver set, its name is added to the Receivers section of the navigation tree. The color of all the base points associated with the newly defined receiver set changes, and an additional little ball with the receiver color (yellow by default) appears at the location of each associated base point. You can open the property dialog of the receiver set and modify a number of parameters.
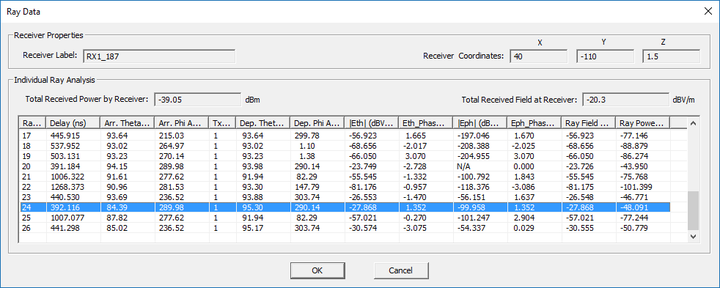
In the Receiver Set dialog, there is a drop-down list labeled Selected Element, which contains a list of all the individual receivers belonging to the receiver set. At the end of an SBR simulation, the button labeled Show Ray Data becomes enabled. Clicking this button opens the Ray Data dialog, where you can see a list of all the received rays at the selected receiver and their computed characteristics.
If you choose the "user defined antenna" option for your receiver set, it indeed consists of a basic "Receiver Chain" that contains a receive antenna connected via a segment of transmission line to the low-noise amplifier (LNA) that is terminated in a matched load. The receiver set's property dialog allows you to define the basic receiver chain. Click the Receiver Chain button of the Receiver Set dialog to open the receiver chain dialog. As shown in the figure below, you can specify the characteristics of the LNA such as its gain and noise figure in dB as well as the characteristics of the transmission line segment that connects the antenna to the LNA. Note that the receiving antenna characteristics are automatically filled from using contents of the radiation file. You have to enter values for antenna's Brightness Temperature as well as the temperature of the transmission line and the receiver's ambient temperature. The effective Receiver Bandwidth is assumed to be 100MHz, which you can change for the purpose of noise calculations. The Receive Chain dialog calculates and reports the "Noise Power" and "Total Receiver Chain Gain" based on your input. At the end of an SBR simulation, the receiver power and signal-noise ratio (SNR) of the selected receiver are calculated and they are reported in the receiver set dialog in dBm and dB, respectively. You can examine the properties of all the individual receivers and all the individual rays received by each receiver in your receiver set using the "Selected Element" drop-down list.
Modulation Waveform and Detection
EM.Terrano allows you to define a digital modulation scheme for your communication link. There are currently 17 waveforms to choose from in the receiver set property dialog:
- OOK
- M-ary ASK
- Coherent BFSK
- Coherent QFSK
- Coherent M-ary FSK
- Non-Coherent BFSK
- Non-Coherent QFSK
- Non-Coherent M-ary FSK
- BPSK
- QPSK
- Offset QPSK
- M-ary PSK
- DBPSK
- pi/4 Gray-Coded DQPSK
- M-ary QAM
- MSK
- GMSK (BT = 0.3)
In the above list, you need to specify the No. Levels (M) for the Mary modulation schemes, from which the No. Bits per Symbol is determined. You can also define a bandwidth for the signal, which has a default value of 100MHz. Once the SNR of the signal is found, given the specified modulation scheme, the Eb/N0 parameter is determined, from which the bit error rate (BER) is calculated.
The Shannon – Hartley Equation estimates the channel capacity:
[math] C = B \log_2 \left( 1 + \frac{S}{N} \right) [/math]
where B in the bandwidth in Hz, and C is the channel capacity (maximum data rate) expressed in bits/s.
The spectral efficiency of the channel is defined as
[math] \eta = \log_2 \left( 1 + \frac{S}{N} \right) [/math]
The quantity Eb/N0 is the ratio of energy per bit to noise power spectral density. It is a measure of SNR per bit and is calculated from the following equation:
[math] \frac{E_b}{N_0} = \frac{ 2^\eta - 1}{\eta} [/math]
where η is the spectral efficiency.
The relationship between the bit error rate and Eb/N0 depends on the modulation scheme and detection type (coherent vs. non-coherent). For example, for coherent QPSK modulation, one can write:
[math] P_b = 0.5 \; \text{erfc} \left( \sqrt{ \frac{E_b}{N_0} } \right) [/math]
where Pb is the bit error rate and erfc(x) is the complementary error function:
[math] \text{erfc}(x) = 1-\text{erf}(x) = \frac{2}{\sqrt{\pi}} \int_{x}^{\infty} e^{-t^2} dt [/math]
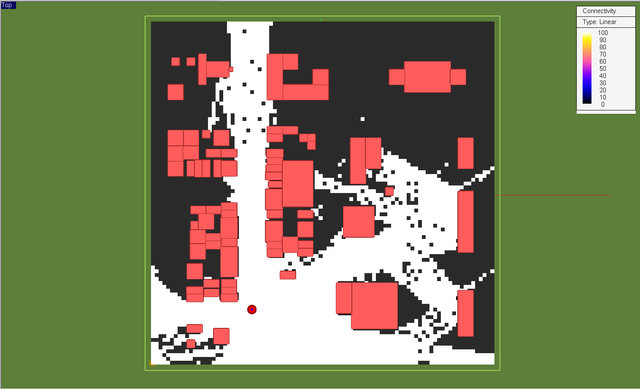
The Minimum Required SNR parameter is used to determine link connectivity between each transmitter and receiver pair. If you check the box labeled Generate Connectivity Map in the receiver set property dialog, a binary map of the propagation scene is generated by EM.Terrano, in which one color represents a closed link and another represent no connection depending on the selected color map type of the graph. EM.Terrano also calculates the Max Permissible BER corresponding to the specified minimum required SNR and displays it in the receiver set property dialog.
A Note on EM.Terrano's Native Dipole Radiators
When you define a new transmitter set or a new receiver set, EM.Terrano assigns a vertically polarized half-wave dipole radiator to the set by default. The radiation pattern of this native dipole radiators is calculated using well-know expressions that are derived based on certain assumptions and approximations. For example, the far-zone electric field of a vertically-polarized dipole antenna can be expressed as:
[math] E_\theta(\theta,\phi) \approx j\eta_0 I_0 \frac{e^{-jk_0 r}}{2\pi r} \left[ \frac{\text{cos} \left( \frac{k_0 L}{2} \text{cos} \theta \right) - \text{cos} \left( \frac{k_0 L}{2} \right) }{\text{sin}\theta} \right] [/math]
[math] E_\phi(\theta,\phi) \approx 0 [/math]
where k0 = 2π/λ0 is the free-space wavenumber, λ0 is the free-space wavelength, η0 = 120π Ω is the free-space intrinsic impedance, I0 is the current on the dipole, and L is the length of the dipole.
The directivity of the dipole antenna is given be the expression:
[math] D_0 \approx \frac{2}{F_1(k_0L) + F_2(k_0L) + F_3(k_0L)} \left[ \frac{\text{cos} \left( \frac{k_0 L}{2} \text{cos} \theta \right) - \text{cos} \left( \frac{k_0 L}{2} \right) }{\text{sin}\theta} \right]^2 [/math]
with
[math] F_1(x) = \gamma + \text{ln}(x) - C_i(x) [/math]
[math] F_2(x) = \frac{1}{2} \text{sin}(x) \left[ S_i(2x) - 2S_i(x) \right] [/math]
[math] F_3(x) = \frac{1}{2} \text{cos}(x) \left[ \gamma + \text{ln}(x/2) + C_i(2x) - 2C_i(x) \right] [/math]
where γ = 0.5772 is the Euler-Mascheroni constant, and Ci(x) and Si(x) are the cosine and sine integrals, respectively:
[math] C_i(x) = - \int_{x}^{\infty} \frac{ \text{cos} \tau}{\tau} d\tau [/math]
[math] S_i(x) = \int_{0}^{x} \frac{ \text{sin} \tau}{\tau} d\tau [/math]
In the case of a half-wave dipole, L = λ0/2, and D0 = 1.643. Moreover, the input impedance of the dipole antenna is ZA = 73 + j42.5 Ω. These dipole radiators are connected via 50Ω transmission lines to a 50Ω source or load. Therefore, there is always a certain level of impedance mismatch that violates the conjugate match condition for maximum power.
On the other hand, we you specify a user-defined antenna pattern for the transmitter or receiver sets, you import a 3D radiation pattern file that contains all the values of Eθ and Eφ for all the combinations of (θ, φ) angles. Besides the three native dipole radiators, EM.Cube also provides 3D radiation pattern files for three X-, Y- and Z-polarized half-wave resonant dipole antennas. These pattern data were generated using a full-wave solver like EM.Libera's wire MOM solver. The names of the radiation pattern files are:
- DPL_STD_X.RAD
- DPL_STD_Y.RAD
- DPL_STD_Z.RAD
and they are located in the folder "\Documents\EMAG\Models" on your computer. Note that these are full-wave simulation data and do not involve any approximate assumptions. To use these files as an alternative to the native dipole radiators, you need to select the User Defined Antenna Pattern radio button as the the radiator type in the transmitter or receiver set property dialog.
A Note on the Rotation of Antenna Radiation Patterns
EM.Terrano's Transmitter Set dialog and Receiver Set dialog both allow you to rotate an imported radiation pattern. In that case, you need to specify the Rotation angles in degrees about the X-, Y- and Z-axes. It is important to note that these rotations are performed sequentially and in the following order: first a rotation about the X-axis, then a rotation about the Y-axis, and finally a rotation about the Z-axis. In addition, all the rotations are performed with respect to the "rotated" local coordinate systems (LCS). In other words, the first rotation with respect to the local X-axis transforms the XYZ LCS to a new primed X′Y′Z′ LCS. The second rotation is performed with respect to the new Y′-axis and transforms the X′Y′Z′ LCS to a new double-primed X′′Y′′Z′′ LCS. The third rotation is finally performed with respect to the new Z′′-axis. The figures below shows single and double rotations.
Adjustment of Tx/Rx Elevation above a Terrain Surface
When your transmitters or receivers are located above a flat terrain like the global ground, their Z-coordinates are equal to their height above the ground, as the terrain elevation is fixed and equal to zero everywhere. In many propagation modeling problems, your transmitters and receivers may be located above an irregular terrain with varying elevation across the scene. In that case, you may want to place your transmitters or receivers at a certain height above the underlying ground. The Z-coordinate of a transmitter or receiver is now the sum of the terrain elevation at the base point and the specified height. EM.Terrano gives you the option to adjust the transmitter and receiver sets to the terrain elevation. This is done for individual transmitter sets and individual receiver sets. At the top of the Transmitter Dialog there is a check box labeled "Adjust Tx Sets to Terrain Elevation". Similarly, at the top of the Receiver Dialog there is a check box labeled "Adjust Rx Sets to Terrain Elevation". These boxes are unchecked by default. As a result, your transmitter sets or receiver sets coincide with their associated base points in the project workspace. If you check these boxes and place a transmitter set or a receiver set above an irregular terrain, the transmitters or receivers are elevated from the location of their associated base points by the amount of terrain elevation as can be seen in the figure below.
To better understand why there are two separate sets of points in the scene, note that a point array (CAD object) is used to create a uniformly spaced base set. The array object always preserves its grid topology as you move it around the scene. However, the transmitters or receivers associated with this point array object are elevated above the irregular terrain and no longer follow a strictly uniform grid. If you move the base set from its original position to a new location, the base points' topology will stay intact, while the associated transmitters or receivers will be redistributed above the terrain based on their new elevations.
Discretizing the Propagation Scene in EM.Terrano
Why Do You Need to Discretize the Scene?
EM.Terrano's SBR solver uses a method known as Geometrical Optics (GO) in conjunction with the Uniform Theory of Diffraction (UTD) to trace the rays from their originating point at the source to the individual receiver locations. Rays may hit obstructing objects on their way and get reflected, diffracted or transmitted. EM.Terrano's SBR solver can only handle diffraction off linear edges and reflection from and transmission through planar interfaces. When an incident ray hits the surface of the obstructing object, a local planar surface assumption is made at the specular point. The assumptions of linear edges and planar facets obviously work in the case of a scene with cubic buildings and a flat global ground.
In many practical scenarios, however, your buildings may have curved surfaces, or the terrain may be irregular. EM.Terrano allows you to draw any type of surface or solid geometric objects such as cylinders, cones, etc. under impenetrable and penetrable surface groups or penetrable volumes. EM.Terrano's mesh generator creates a triangular surface mesh of all the objects in your propagation scene, which is called a facet mesh. Even the walls of cubic buildings are meshed using triangular cells. This enables EM.Terrano to properly discretize composite buildings made of conjoined cubic objects.
Unlike EM.Cube's other computational modules, the density or resolution of EM.Terrano's surface mesh does not depend on the operating frequency and is not expressed in terms of the wavelength. The sole purpose of EM.Terrano's facet mesh is to discretize curved and irregular scatterers into flat facets and linear edges. Therefore, geometrical fidelity is the only criterion for the quality of a facet mesh. It is important to note that discretizing smooth objects using a triangular surface mesh typically creates a large number of small edges among the facets that are simply mesh artifacts and should not be considered as diffracting edges. For example, each rectangular face of a cubic building is subdivided into four triangles along the two diagonals. The four internal edges lying inside the face are obviously not diffracting edges. A lot of subtleties like these must be taken into account by the SBR solver to run accurate and computationally efficient simulations.
Generating the Facet Mesh
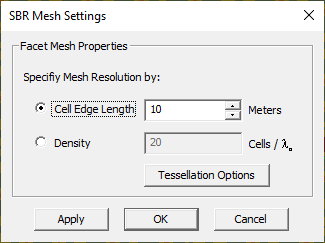
You can view and examine the discretized version of your scene's objects as they are sent to the SBR simulation engine. You can adjust the mesh resolution and increase the geometric fidelity of discretization by creating more and finer triangular facets. On the other hand, you may want to reduce the mesh complexity and send to the SBR engine only a few coarse facets to model your buildings. The resolution of EM.Terrano's facet mesh generator is controlled by the Cell Edge Length parameter, which is expressed in project length units. The default mesh cell size of 100 units might be too large for non-flat objects. You may have to set a smaller cell edge length in EM.Terrano's Mesh Settings dialog, along with a lower curvature angle tolerance value to capture the curvature of your curved structures adequately.
![]() Click here to learn more about Working with Mesh Generator.
Click here to learn more about Working with Mesh Generator.
![]() Click here to learn more about the properties of EM.Terrano's Facet Mesh Generator.
Click here to learn more about the properties of EM.Terrano's Facet Mesh Generator.
Running Ray Tracing Simulations in EM.Terrano
EM.Terrano provides a number of different simulation or solver types:
- 3D Field Solver
- SBR Channel Analyzer
- Log-Haul Channel Analyzer
- Communication Link Solver
- Radar Link Solver
The first three simulation types are described below. For a description of EM.Terrano's Radar Simulator, follow this link.
Running a Single-Frequency SBR Analysis
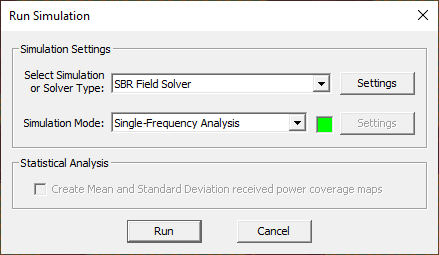
Its main solver is the 3D SBR Ray Tracer. Once you have set up your propagation scene in EM.Terrano and have defined sources/transmitters and observables/receivers for your scene, you are ready to run a SBR ray tracing simulation. You set the simulation mode in EM.Terrano's simulation run dialog. A single-frequency SBR analysis is a single-run simulation and the simplest type of ray tracing simulation in EM.Terrano. It involves the following steps:
- Set the units of your project and the frequency of operation. Note that the default project unit is millimeter. Wireless propagation problems usually require meter, mile or kilometer as the project unit.
- Create the blocks and draw the buildings at the desired locations.
- Keep the default ray domain and accept the default global ground or change its material properties.
- Define an excitation source and observables for your project.
- If you intend to use transmitters and receivers in your scene, first define the required base sets and then define the transmitter and receiver sets based on them.
- Run the SBR simulation engine.
- Visualize the coverage map and plot other data.
You can access EM.Terrano's Simulation Run dialog by clicking the Run ![]() button of the Simulate Toolbar or by selecting Simulate → Run... or using the keyboard shortcut Ctrl+R. When you click the Run button, a new window opens up that reports the different stages of the SBR simulation and indicates the progress of each stage. After the SBR simulation is successfully completed, a message pops up and prompts the completion of the process.
button of the Simulate Toolbar or by selecting Simulate → Run... or using the keyboard shortcut Ctrl+R. When you click the Run button, a new window opens up that reports the different stages of the SBR simulation and indicates the progress of each stage. After the SBR simulation is successfully completed, a message pops up and prompts the completion of the process.
Changing the SBR Engine Settings
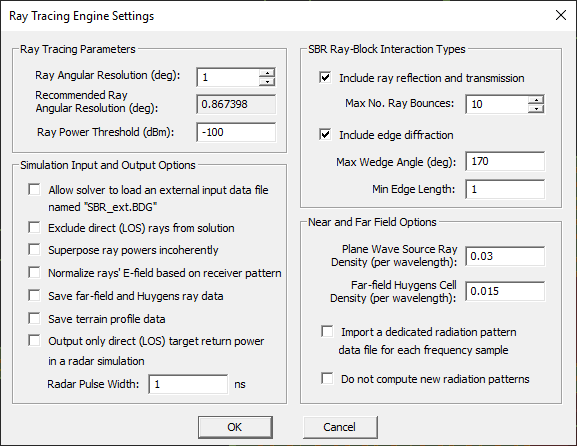
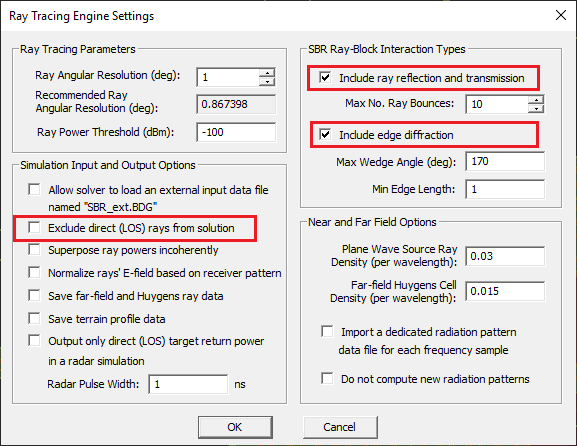
There are a number of SBR simulation settings that can be accessed and changed from the Ray Tracing Engine Settings Dialog. To open this dialog, click the button labeled Settings on the right side of the Select Simulation or Solver Type drop-down list in the Run Dialog. EM.Terrano's SBR simulation engine allows you to separate the physical effects that are calculated during a ray tracing process. You can selectively enable or disable Reflection/Transmission and Edge Diffraction in the "Ray-Block Interactions" section of this dialog. By default, ray reflection and transmission and edge diffraction effects are enabled. Separating these effects sometimes help you better analyze your propagation scene and understand the impact of various blocks in the scene.
EM.Terrano allows a finite number of ray bounces for each original ray emanating from a transmitter. This is very important in situations that may involve resonance effects where rays get trapped among multiple surfaces and may bounce back and forth indefinitely. This is set using the box labeled "Max No. Ray Bounces", which has a default value of 10. Note that the maximum number of ray bounces directly affects the computation time as well as the size of output simulation data files. This can become critical for indoor propagation scenes, where most of the rays undergo a large number of reflections. Two other parameters control the diffraction computations: Max Wedge Angle in degrees and Min Edge Length in project units. The maximum wedge angle is the angle between two conjoined facets that is considered to make them almost flat or coplanar with no diffraction effect. The default value of the maximum wedge angle is 170°. The minimum edge length is size of the common edge between two conjoined facets that is considered as a mesh artifact and not a real diffracting edge. The default value of the minimum edge length is one project units.
As rays travel in the scene and bounce from surfaces, they lose their power, and their amplitudes gradually diminish. From a practical point of view, only rays that have power levels above the receiver sensitivity can be effectively received. Therefore, all the rays whose power levels fall below a specified power threshold are discarded. The Ray Power Threshold is specified in dBm and has a default value of -150dBm. Keep in mind that the value of this threshold directly affects the accuracy of the simulation results as well as the size of the output data file.
You can also set the Ray Angular Resolution of the transmitter rays in degrees. By default, every transmitter emanates equi-angular ray tubes at a resolution of 1 degree. Lower angular resolutions larger than 1° speed up the SBR simulation significantly, but they may compromise the accuracy. Higher angular resolutions less than 1° increase the accuracy of the simulating results, but they also increase the computation time. The SBR Engine Settings dialog also displays the Recommended Ray Angular Resolution in degrees in a grayed-out box. This number is calculated based on the overall extents of your computational domain as well as the SBR mesh resolution. To see this value, you have to generate the SBR mesh first. Keeping the angular resolution of your project above this threshold value makes sure that the small mesh facets at very large distances from the source would not miss any impinging ray tubes during the simulation.
EM.Terrano gives a few more options for the ray tracing solution of your propagation problem. For instance, it allows you to exclude the direct line-of-sight (LOS) rays from the final solution. There is a check box for this purpose labeled "Exclude direct (LOS) rays from the solution", which is unchecked by default. EM.Terrano also allows you to superpose the received rays incoherently. In that case, the powers of individual ray are simply added to compute that total received power. This option in the check box labeled "Superpose rays incoherently" is disabled by default, too.
At the end of a ray tracing simulation, the electric field of each individual ray is computed and reported. By default, the actual received ray fields are reported, which are independent of the radiation pattern of the receive antennas. EM.Terrano provides a check box labeled "Normalize ray's E-field based on receiver pattern", which is unchecked by default. If this box is checked, the field of each ray is normalized so as to reflect that effect of the receiver antenna's radiation pattern. The received power of each ray is calculated from the following equation:
[math] P_{ray} = \frac{ | \mathbf{E_{norm}} |^2 }{2\eta_0} \frac{\lambda_0^2}{4\pi} [/math]
It can be seen that if the ray's E-field is not normalized, the computed ray power will correspond to that of a polarization matched isotropic receiver.
Polarimetric Channel Analysis
In a 3D SBR simulation, a transmitter shoots a large number of rays in all directions. The electric fields of these rays are polarimetric and their strength and polarization are determined by the designated radiation pattern of the transmit antenna. The rays travel in the propagation scene and bounce from the ground and buildings or other scatterers or get diffracted at the building edges until they reach the location of the receivers. Each individual ray has its own vectorial electric field and power. The electric fields of the received rays are then superposed coherently and polarimetrically to compute the total field at the receiver locations. The designated radiation pattern of the receivers is then used to compute the total received power by each individual receiver.
From a theoretical point of view, the radiation patterns of the transmit and receive antennas are independent of the propagation channel characteristics. For the given locations of the point transmitters and receivers, one can assume ideal isotropic radiators at these points and compute the polarimetric transfer function matrix of the propagation channel. This matrix relates the received electric field at each receiver location to the transmitted electric field at each transmitter location. In general, the vectorial electric field of each individual ray is expressed in the local standard spherical coordinate system at the transmitter and receiver locations. In other words, the polarimetric channel matrix expresses the Eθ and Eφ field components associated with each ray at the receiver location to its Eθ and Eφ field components at the transmitter location. Each ray has a delay and θ and φ angles of departure at the transmitter location and θ and φ angles of departure at the receiver location.
To perform a polarimatric channel characterization of your propagation scene, open EM.Terrano's Run Simulation dialog and select Channel Analyzer from the drop-down list labeled Select Simulation or Solver Type. At the end of the simulation, a large ray database is generated with two data files called "sbr_channel_matrix.DAT" and "sbr_ray_path.DAT". The former file contains the delay, angles of arrival and departure and complex-valued elements of the channel matrix for all the individual rays that leave each transmitter and arrive at each receiver. The latter file contains the geometric aspects of each ray such as hit point coordinates.
The "Near Real-Time" Polarimatrix Solver
After EM.Terrano's channel analyzer generates a ray database that characterizes your propagation channel polarimetrically for all the combinations of transmitter and receiver locations, a ray tracing solution of the propagation problem can readily be found in almost real time by incorporating the effects of the radiation patterns of transmit and receive antennas. This is done using the Polarimatrix Solver, which is the third option of the drop-down list labeled Select Simulation or Solver Type in EM.Terrano's Run Simulation dialog. The results of the Polarimatrix and 3D SBR solvers must be identical from a theoretical point of view. However, there might be small discrepancies between the two solutions due to roundoff errors.
Using the Polarimatrix solver can lead to a significant reduction of the total simulation time in sweep simulations that involve a large number of transmitters and receivers. Certain simulation modes of EM.Terrano are intended for the Polarimatrix solver only as will be described in the next section.
| |
In order to use the Polarimatrix solver, you must first generate a ray database of your propagation scene using EM.Terrano's Channel Analyzer. |
EM.Terrano's Simulation Modes
EM.Terrano provides a number of different simulation modes that involve single or multiple simulation runs:
| Simulation Mode | Usage | Which Solver? | Frequency | Restrictions |
|---|---|---|---|---|
| Single-Frequency Analysis | Simulates the propagation scene "As Is" | SBR, Channel Analyzer, Polarimatrix, Radar Simulator | Runs at the center frequency fc | None |
| Frequency Sweep | Varies the operating frequency of the ray tracer | SBR, Channel Analyzer, Polarimatrix, Radar Simulator | Runs at a specified set of frequency samples | None |
| Parametric Sweep | Varies the value(s) of one or more project variables | SBR | Runs at the center frequency fc | Requires definition of sweep variables, works only with SBR solver as the physical scene may change during the sweep |
| Transmitter Sweep | Activates two or more transmitters sequentially with only one transmitter broadcasting at each simulation run | Polarimatrix | Runs at the center frequency fc | Requires at least two transmitters in the scene, works only with Polarimatrix solver and requires an existing ray database |
| Rotational Sweep | Rotates the radiation pattern of the transmit antenna(s) sequentially to model beam steering | Polarimatrix | Runs at the center frequency fc | Works only with Polarimatrix solver and requires an existing ray database |
| Mobile Sweep | Considers one pair of active transmitter and receiver at each simulation run to model a mobile communication link | Polarimatrix | Runs at the center frequency fc | Requires the same number of transmitters and receivers, works only with Polarimatrix solver and requires an existing ray database |
Click on each item in the above list to learn more about each simulation mode.
You set the simulation mode in EM.Terrano's simulation run dialog using the drop-down list labeled Simulation Mode. A single-frequency analysis is a single-run simulation. All the other simulation modes in the above list are considered multi-run simulations. In multi-run simulation modes, certain parameters are varied and a collection of simulation data files are generated. At the end of a sweep simulation, you can plot the output parameter results on 2D graphs or you can animate the 3D simulation data from the navigation tree.
| |
EM.Terrano's frequency sweep simulations are very fast because the geometrical optics (ray tracing) part of the simulation is frequency-independent. |
Transmitter Sweep
When your propagation scene contains two or more transmitters, whether they all belong to the same transmitter set with the same radiation pattern or to different transmitter sets, EM.Terrano assumes all to be coherent with respect to one another. In other words, synchronous transmitters are always assumed. The rays originating from all these transmitters are superposed coherently and vectorially at each receiver. In a transmitter sweep, on the other hand, EM.Terrano assumes only one transmitter broadcasting at a time. The result of the sweep simulation is a number of received power coverage maps, each corresponding to a transmitter in the scene.
| |
EM.Terrano's transmitter sweep works only with the Polarimatrix Solver and requires an existing ray database previously generated using the Channel Analyzer. |
Rotational Sweep
You can rotate the 3D radiation patterns of both the transmitters and receivers from the property dialog of the parent transmitter set or receiver set. This is done in advance before a SBR simulation starts. You can define one or more of the rotation angles of a transmitter set or a receiver set as sweep variables and perform a parametric sweep simulation. In that case, the entire scene and all of its buildings are discretized at each simulation run and a complete physical SBR ray tracing simulation is carried out. However, we know that the polarimetric characteristics of the propagation channel are independent of the transmitter or receiver antenna patterns or their rotation angles. A rotational sweep allows you to rotate the radiation pattern of the transmitter(s) about one of the three principal axes sequentially. This is equivalent to the steering of the beam of the transmit antenna either mechanically or electronically. The result of the sweep simulation is a number of received power coverage maps, each corresponding to one of the angular samples. To run a rotational sweep, you must specify the rotation angle.
| |
EM.Terrano's rotational sweep works only with the Polarimatrix Solver and requires an existing ray database previously generated using the Channel Analyzer. |
Mobile Sweep
In a mobile sweep, each transmitter is paired with a receiver according to their indices in their parent sets. At each simulation run, only one (Tx, Rx) pair is considered to be active in the scene. As a result, the generated coverage map takes a different meaning implying the sequential movement of the transmitter and receiver pair along their corresponding paths. In other words, the set of point transmitters and the set of point receivers indeed represent the locations of a single transmitter and a single receiver at different instants of time. It is obvious that the total number of transmitters and total number of receivers in the scene must be equal. Otherwise, EM.Terrano will prompt an error message.
EM.Cube provides a Mobile Path Wizard that facilitates the creation of a transmitter set or a receiver set along a specified path. This path can be an existing nodal curve (polyline or NURBS curve) or an existing line objects. You can also import a sptial Cartesian data file containing the coordinates of the base location points. For more information, refer to Mobile Path Wizard.
| |
EM.Terrano's mobile sweep works only with the Polarimatrix Solver and requires an existing ray database previously generated using the Channel Analyzer. |
Investigating Propagation Effects Selectively One at a Time
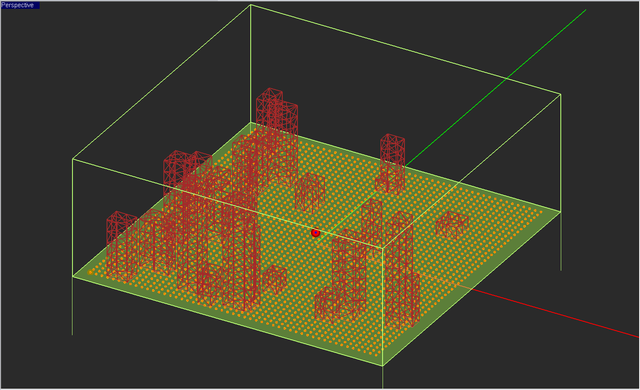
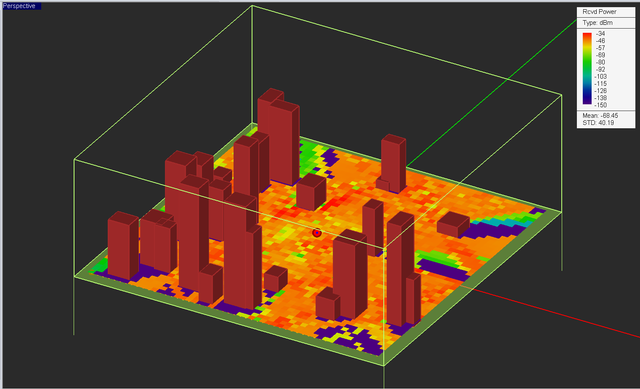
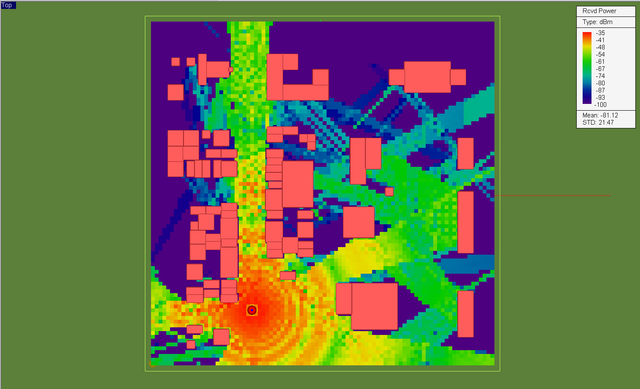
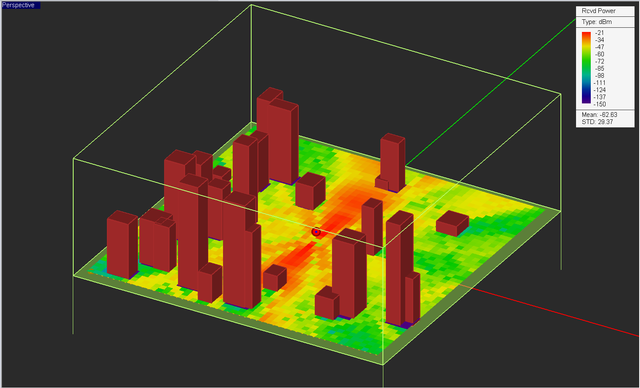
In a typical SBR ray tracing simulation, EM.Terrano includes all the propagation effects such as direct (LOS) rays, ray reflection and transmission, and edge diffractions. At the end of a SBR simulation, you can visualize the received power coverage map of your propagation scene, which appears under the receiver set item in the navigation tree. The figure below shows the received power coverage map of the random city scene with a vertically polarized half-wave dipole transmitter located 10m above the ground and a large grid of vertically polarized half-wave dipole receivers placed 1.5m above the ground. The legend box shows the limits of the color map between -23dBm as the maximum and -150dB (the default receiver sensitivity value) as the minimum.
Sometime it is helpful to change the scale of the color map to better understand the dynamic range of the coverage map. If you double-click on the legend or right-click on the coverage map's name in the navigation tree and select Properties, the Plot Settings dialog opens up. Select the User-Defined item and set the lower and upper bounds of color map as you wish.
To better understand the various propagation effects, EM.Terrano allows you to enable or disable these effects selectively. This is done from the Ray Tracing Simulation Engine Settings dialog using the provided check boxes.
Working with EM.Terrano's Simulation Data
The Ray Tracing Solvers' Output Simulation Data
Both the SBR solver and the Polarimatrix solver perform the same type of simulation but in two different ways. The SBR solver discretizes the scene including all the buildings and terrain, shoots a large number of rays from the transmitters and collects the rays at the receivers. The Polarimatrix solver does the same thing using an existing polarimetric ray database that has been previously generated using EM.Terrano's Channel Analyzer. It incorporates the effects of the radiation patterns of the transmit and receive antennas in conjunction with the polarimetric channel characteristics. At the end of a ray tracing simulation, all the polarimetric rays emanating from the transmitter(s) or other sources that are received by the individual receivers are computed, collected, sorted and saved into ASCII data files. From the ray data, the total electric field at the location of receivers as well as the total received power are computed. The individual ray data include the field components of each ray, the ray's elevation and azimuth angles of departure and arrival (departure from the transmitter location and arrival at the receiver location), and time delay of the received ray with respect to the transmitter. If you specify the temperatures, noise figure and transmission line losses in the definition of the receiver sets, the noise power level and signal-to-noise ratio (SNR) at each receiver are also calculated, and so are the Eb/N0 and bit error rate (BER) for the selected digital modulation scheme.
Visualizing Field & Received Power Coverage Maps
In wireless propagation modeling for communication system applications, the received power at the receiver location is more important than the field distributions. In order to compute the received power, you need three pieces of information:
- Total Transmitted Power (EIRP): This requires knowledge of the baseband signal power, the transmitter chain parameters, the transmission characteristics of the transmission line connecting the transmitter circuit to the transmitting antenna and the radiation characteristics of the transmitting antenna.
- Channel Path Loss: This is computed through SBR simulation.
- Receiver Properties: This includes the radiation characteristics of the receiving antenna, the transmission characteristics of the transmission line connecting the receiving antenna to the receiver circuit and the receiver chain parameters.
In a simple link scenario, the received power Pr in dBm is found from the following equation:
[math] P_r [dBm] = P_t [dBm] + G_{TC} + G_{TA} - PL + G_{RA} + G_{RC} [/math]
where Pt is the baseband signal power in dBm at the transmitter, GTC and GRC are the total transmitter and receiver chain gains in dB, respectively, GTA and GRA are the total transmitting and receiving antenna gains in dB, respectively, and PL is the channel path loss in dB. Keep in mind that EM.Terrano is fully polarimetric. The transmitting and receiving antenna characteristics are specified through the imported radiation pattern files, which are part of the definition of the transmitters and receivers. In particular, the polarization mismatch losses are taken into account through the polarimetric SBR ray tracing analysis.
If you specify the noise-related parameters of your receiver set, the signal-to-noise ratios (SNR) is calculated at each receiver location: SNR = Pr - Pn, where Pn is the noise power level in dB. When planning, designing and deploying a communication system between points A and B, the link is considered to be closes and a connection established if the received signal power at the location of the receiver is above the noise power level by a certain threshold. In other words, the SNR at the receiver must be greater than a certain specified minimum SNR level. You specify (SNR)min ss part of the definition of receiver chain in the Receiver Set dialog. In the "Visualization Options" section of this dialog, you can also check the check box labeled Generate Connectivity Map. This is a binary-level black-and-white map that displays connected receivers in white and disconnected receivers in black. At the end of an SBR simulation, the computed SNR is displayed in the Receiver Set dialog for the selected receiver. The connectivity map is generated and added to the navigation tree underneath the received power coverage map node.
At the end of an SBR simulation, you can visualize the field maps and receiver power coverage map of your receiver sets. A coverage map shows the total Received Power by each of the receivers and is visualized as a color-coded intensity plot. Under each receiver set node in the navigation tree, a total of seven field maps together with a received power coverage map are added. The field maps include amplitude and phase plots for the three X, Y, Z field components plus a total electric field plot. To display a field or coverage map, simply click on its entry in the navigation tree. The 3D plot appears in the Main Window overlaid on your propagation scene. A legend box on the right shows the color scale and units (dB). The 3D coverage maps are displayed as horizontal confetti above the receivers. You can change the appearance of the receivers and maps from the property dialog of the receiver set. You can further customize the settings of the 3D field and coverage plots.
Visualizing the Rays in the Scene
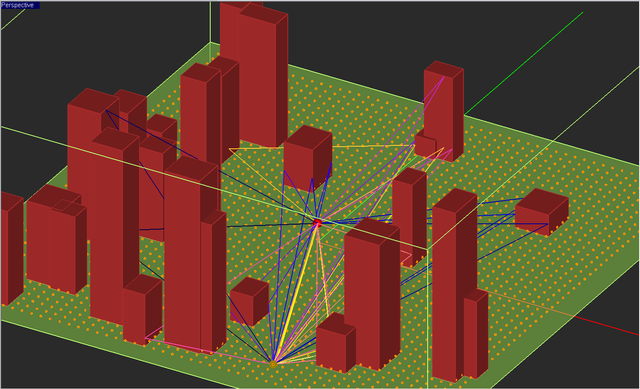
At the end of a SBR simulation, each receiver receives a number of rays. Some receivers may not receive any rays at all. You can visualize all the rays received by a certain receiver from the active transmitter of the scene. To do this, right click the Receivers item of the Navigation Tree. From the context menu select Show Received Rays. All the rays received by the currently selected receiver of the scene are displayed in the scene. The rays are identified by labels, are ordered by their power and have different colors for better visualization. You can display the rays for only one receiver at a time. The receiver set property dialog has a list of all the individual receivers belonging to that set. To display the rays received by another receiver, you have to change the Selected Receiver in the receiver set's property dialog. If you keep the mouse focus on this dropdown list and roll your mouse scroll wheel, you can scan the selected receivers and move the rays from one receiver to the next in the list. To remove the visualized rays from the scene, right click the Receivers item of the Navigation Tree again and from the context menu select Hide Received Rays.
You can also view the ray parameters by opening the property dialog of a receiver set. By default, the first receiver of the set is always selected. You can select any other receiver from the drop-down list labeled Selected Receiver. If you click the button labeled Show Ray Data, a new dialog opens up with a table that contains all the received rays at the selected receiver and their parameters:
- Delay is the total time delay that a ray experiences travelling from the transmitter to the receiver after all the reflections, transmissions and diffractions and is expressed in nanoseconds.
- Ray Field is the received electric field at the receiver location due to a specific ray and is given in dBV/m.
- Ray Power is the received power at the receiver due to a specific ray and is given in dBm.
- Angles of Arrival are the θ and φ angles of the incoming ray at the local spherical coordinate system of the receiver.
The Ray Data Dialog also shows the Total Received Power in dBm and Total Received Field in dBV/m due to all the rays received by the receiver. You can sort the rays based on their delay, field, power, etc. To do so, simply click on the grey column label in the table to sort the rays in ascending order based on the selected parameter. You can also select any ray by clicking on its ID and highlighting its row in the table. In that case, the selected rays is highlighted in the Project Workspace and all the other rays become thin (faded).
| |
All the received rays are summed up coherently in a vectorial manner at the receiver location. |
The Standard Output Data File
At the end of an SBR simulation, EM.Terrano writes a number of ASCII data files to your project folder. The main output data file is called "sbr_results.RTOUT". This file contains all the information about individual receivers and the parameters of each ray that is received by each individual receiver. At the end of an SBR simulation, the results are written into a main output data file with the reserved name of SBR_Results.RTOUT. This file has the following format:
Each receiver line has the following information:
- Receiver ID
- Receiver X, Y, Z coordinates
- Total received power in dBm
- Total number of received rays
Each rays line received by a receiver has the following information:
- Ray Index
- Delay in nsec
- θ and φ Angles of Arrival in deg
- θ and φ Angles of Departure in deg
- Real and imaginary parts of the three Ex, Ey, Ez components
- Number of ray hit points
- Coordinates of individual hit points
The angles of arrival are the θ and φ angles of a received ray measured in degrees and are referenced in the local spherical coordinate systems centered at the location of the receiver. The angles of departure for a received ray are the θ and φ angles of the originating transmitter ray, measured in degrees and referenced in the local spherical coordinate systems centered at the location of the active transmitter, which eventually arrives at the receiver. The total time delay is measured in nanoseconds between t = 0 nsec at the time of launch from the transmitter location till being received at the receiver location.
Plotting Other Simulation Results
Besides "sbr_results.out", EM.Terrano writes a number of other ASCII data files to your project folder. You can view or plot these data in EM.Cube's Data Manager. You can open data manager by clicking the Data Manager ![]() button of the Simulate Toolbar or by selecting Menu > Simulate > Data Manager from the menu bar or by right-clicking on the Data Manager item of the navigation tree and selecting Open Data Manager... from the contextual menu or by using the keyboard shortcut Ctrl+D.
button of the Simulate Toolbar or by selecting Menu > Simulate > Data Manager from the menu bar or by right-clicking on the Data Manager item of the navigation tree and selecting Open Data Manager... from the contextual menu or by using the keyboard shortcut Ctrl+D.
The available data files in the "2D Data Files" tab of Data Manger include:
- Path Loss: The channel path loss is defined as PL = Pr - EIRP. The path loss data are stored in a file called "SBR_receiver_set_name_PATHLOSS.DAT" as a function of the receiver index. The path loss data make sense only if your receiver set has the default isotropic radiator.
- Power Delay Profile: The delays of the individual rays received by the selected receiver with respect to the transmitter are expressed in ns and tabulated together with the power of each ray in the file "SBR_receiver_set_name_DELAY.DAT". You can plot these data from the Data Manager as a bar chart called the power delay profile. The bars indeed correspond to the difference between the ray power in dBm and the minimum power threshold level in dBm, which makes them a positive quantity.
- Angles of Arrival: These are the Theta and Phi angles of the individual rays received by the selected receiver and saved to the files "SBR_receiver_set_name_ThetaARRIVAL.ANG" and "SBR_receiver_set_name_PhiARRIVAL.ANG". You can plot them in the Data Manager in polar stem charts.
When you run a frequency or parametric sweep in EM.Terrano, a tremendous amount of data may be generated. EM.Terrano only stores the Received Power, Path Loss and SNR of the selected receiver in ASCII data files called "PREC_i.DAT", "PL_i.DAT" and "SNR_i.DAT", where is the index of the receiver set in your scene. These quantities are tabulated vs. the sweep variable's samples. You can plot these files in EM.Grid.
![]() Click here to learn more about working with data filed and plotting graphs in EM.Cube's Data Manager.
Click here to learn more about working with data filed and plotting graphs in EM.Cube's Data Manager.
Visualizing 3D Radiation Patterns of Transmit and Receive Antennas in the Scene
When you designate a "User Defined Antenna Pattern" as the radiator type of a transmitter set or a receiver set, EM.Terrano copies the imported radiation pattern data file from its original folder to the current project folder. The name of the ".RAD" file is listed under the 3D Data Files tab of the data manager. Sometimes it might be desired to visualize these radiation patterns in your propagation scene at the actual location of the transmitter or receiver. To do so, you have to define a new Radiation Pattern observable in the navigation tree. The label of the new observable must be identical to the name of the ".RAD" data file. In addition, the Theta and Phi angle increments of the new radiation pattern observable (expressed in degrees) must be identical to the Theta and Phi angular resolutions of the imported pattern file. If all these conditions are met, then go to the Simulate Menu and select the item Update All 3D Visualization. The contents of the 3D radiation patterns are added to the navigation tree. Click on one of the radiation pattern items in the navigation tree and it will be displayed in the scene.
By Default, EM.Cube always visualizes the 3D radiation patterns at the origin of coordinates, i.e. at (0, 0, 0). This is because that radiation pattern data are computed in the standard spherical coordinate system centered at (0, 0, 0). The theta and phi components of the far-zone electric fields are defined with respect to the X, Y and Z axes of this system. When visualizing the 3D radiation pattern data in a propagation scene, it is more intuitive to display the pattern at the location of the transmitter or receiver. The Radiation Pattern dialog allows you to translate the pattern visualization to any arbitrary point in the project workspace. It also allows you to scale up or scale down the pattern visualization with respect to the background scene.
In the example shown above, the imported pattern data file is called "Dipole_Array1.RAD". Therefore, the label of the radiation pattern observable is chosen to be "Dipole_Array1". The theta and phi angle increments are both 1° in this case. The radiation pattern has been elevated by 10m to be positioned at the location of the transmitter and a scaling factor of 0.3 has been used.
There is an important catch to remember here. When you define a radiation pattern observable for your project, EM.Terrano will attempt to compute the overall effective radiation pattern of the entire physical structure. However, in this case, you defined the radiation pattern observable merely for visualization purposes. To stop EM.Terrano from computing the actual radiation pattern of your entire scene, there is a check box in EM.Terrano's Ray Tracer Simulation Engine Settings dialog that is labeled Do not compute new radiation patterns. This box is checked by default, which means the actual radiation pattern of your entire scene will not be computed automatically. But you need to remember to uncheck this box if you ever need to compute a new radiation pattern using EM.Terrano's SBR solver as an asymptotic EM solver (see next section).
Using EM.Terrano as an Asymptotic Field Solver
Like every other electromagnetic solver, EM.Terrano's SBR ray tracer requires an excitation source and one or more observables for the generation of simulation data. EM.Terrano offers several types of sources and observables for a SBR simulation. You already learned about the transmitter set as a source and the receiver set as an observable. You can mix and match different source types and observable types depending on the requirements of your modeling problem.
The available source types in EM.Terrano are:
| Icon | Source Type | Applications | Restrictions |
|---|---|---|---|
| |
Point Transmitter Set | Modeling realsitic antennas & link budget calculations | Requires to be associated with a base location point set |
| |
Hertzian Short Dipole | Almost omni-directional physical radiator | None, stand-alone source |
| |
Huygens Source | Used for modeling equivalent sources imported from other EM.Cube modules | None, stand-alone source imported from a Huygens surface data file |
Click on each type to learn more about it in the Glossary of EM.Cube's Materials, Sources, Devices & Other Physical Object Types.
The available observables types in EM.Terrano are:
| Icon | Source Type | Applications | Restrictions |
|---|---|---|---|
| |
Point Receiver Set | Generating received power coverage maps & link budget calculations | Requires to be associated with a base location point set |
| |
Distributed Receiver Set | Computing received power at a receiver characterized by Huygens surface data | None, stand-alone source imported from a Huygens surface data file |
| |
Near-Field Sensor | Generating electric and magnetic field distribution maps | None, stand-alone observable |
| |
Far-Field Radiation Pattern | Computing the effective radiation pattern of a radiator in the presence of a large scattering scene | None, stand-alone observable |
| |
Huygens Surface | Collecting tangential field data on a box to be used later as a Huygens source in other EM.Cube modules | None, stand-alone observable |
Click on each type to learn more about it in the Glossary of EM.Cube's Simulation Observables & Graph Types.
When you define a far-field observable in EM.Terrano, a collection of invisible, isotropic receivers are placed on the surface of a large sphere that encircles your propagation scene and all of its geometric objects. These receivers are placed uniformly on the spherical surface at a spacing that is determined by your specified angular resolutions. In most cases, you need to define angular resolutions of at least 1° or smaller. Note that this is different than the transmitter rays' angular resolution. You may have a large number of transmitted rays but not enough receivers to compute the effective radiation pattern at all azimuth and elevation angles. Also keep in mind that with 1° Theta and Phi angle increments, you will have a total of 181 × 361 = 65,341 spherically placed receivers in your scene.
| |
Computing radiation patterns using EM.Terrano's SBR solver typically takes much longer computation times than using EM.Cube's other computational modules. |
Statistical Analysis of Propagation Scene
EM.Terrano's coverage maps display the received power at the location of all the receivers. The receivers together from a set/ensemble, which might be uniformly spaced or distributed across the propagation scene or may consist of randomly scattered radiators. Every coverage map shows the Mean and Standard Deviation of the received power for all the receivers involved. These information are displayed at the bottom of the coverage map's legend box and are expressed in dB.
When you run either a frequency sweep or a parametric sweep simulation in EM.Terrano, you have the option to generate two additional coverage maps: one for the mean of all the individual sample coverage maps and another for their standard deviation. To do so, in the Run Dialog, check the box labeled "Create Mean and Standard Deviation received power coverage maps". Note that the mean and standard deviation values displayed on the individual coverage maps correspond to the spatial statistics of the receivers in the scene, while the mean and standard deviation coverage maps show the statistics with respect to the frequency or other sweep variable sets at each point in the site. Also, note that both of the mean and standard deviation coverage maps have their own spatial mean and standard deviation values expressed in dB at the bottom of their legend box.

