Application Note 2: Modeling Polarimetric Wave Propagation In The Lower Manhattan Scene Using EM.Terrano
Contents
Introduction
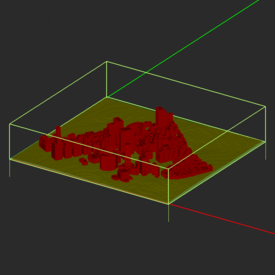
In this application note, we will demonstrate how EM.Terrano can be used to analyze a very large urban canyon propagation scene using its ultrafast k-d tree based ray tracer. Specifically, we will construct a scene representing a portion of lower Manhattan, NY, with real-sized models of its buildings and terrain profile. The total size of the area is 1.3km × 1.2km, and it will be covered with a very large rectangular grid of receivers equally spaced with a uniform spacing of 5m. You can learn more about the basic procedure for setting up an propagation scene and running a SBR simulation in "EM.Terrano Tutorial Lesson 3: Analyzing A Multipath Outdoor Propagation Scene".
An Overview of the SBR Method and k-d Tree Formalism
EM.Terrano's simulation engine performs an asymptotic ray tracing analysis of a given propagation scene based on a technique known as Shoot-and-Bounce-Rays (SBR). This technique combines geometrical optics (GO) ray tracing with the uniform theory of diffraction (UTD) to model ray reflections from surfaces, ray transmission/penetration through walls and material media and diffractions at the edges and corners of buildings [1]-[2]. EM.Terrano's SBR solver is a true 3D, polarimetric and coherent electromagnetic ray tracer, which tracks all the three X, Y and Z components of the electric field and accurately computes both magnitude and phase of all field components at every point in space.
The SBR method assumes that electric fields propagate as spherical waves with the general form:
[math] \mathbf{A}(\mathbf{r}) \frac{e^{-jkR}}{R} [/math]
where R = |r-r'| is the distance between the source and observation points, r and r' are the position vectors of the observation and source points, respectively, k = √εrk0, εr is the relative permittivity of the propagation medium, k0 = 2πf/c is the free-space propagation constant, f is the operational frequency and c is the speed of light in the free space. A(r) is complex vector function that defines the polarization and strength of the field at the observation point. Propagating spherical waves are modeled as ray tubes or beams that emanate from a field source point (transmitter), travel in the free space, bounce from obstacles and scatterers and are collected at a field observation point (receiver). As a ray tube travels in space, its footprint expands due to the beam's spatial divergence. Every scatterer in the scene is discretized into a group of conjoined triangular facets. When a propagating ray is intercepted by a facet, one of the following events takes place:
- The incident ray is reflected back into the free space.
- The incident ray penetrates into the other side of the facet.
- The incident ray is diffracted from one of the three edges of the facet.
Therefore, a ray-triangle intersection algorithm is required to test if a given ray hits a given facet of a building. Unfortunately, even very fast ray-triangle intersection algorithms are computationally very expensive. If the mesh triangles are not organized spatially, a brute-force SBR solver will have to perform N×M intersection calculations, where N is the total number of rays and M is the total number of triangular facets in the scene. This is one of the main reasons why conventional ray tracers take significant amounts of time to solve large-scale propagation scenes that involve hundreds of buildings and thousands of rays.
The solution to the geometric problem of ray-facet intersections can be significantly accelerated by using a k-dimensional (k-d) tree to subdivide the computational domain. A k-d tree, a special case of a binary tree, is a spatial partitioning data structure that is used for organizing points in a k-dimensional space. Using a k-d tree reduces the number of ray-triangle intersection calculations that is required for each ray. In other words, the algorithm used to navigate or traverse a k-d tree is computationally less expensive than a brute-force ray-triangle intersection calculation. The k-d tree is constructed by dividing the computational domain into two partitions and then sorting all the triangles into the two partitions. This process is repeated for the two newly generated partitions until a termination criterion is met. The key to constructing a useful and computationally efficient k-d tree is intelligently deciding on when and where to split each space. A well constructed k-d tree can be many times faster than a poorly constructed one.
After constructing a k-d tree for a given propagation scene, all the triangular facets of the simulation domain are organized spatially. Each k-d tree leaf is loaded with a list of all the facets that are contained in that leaf. Each shooting ray will traverse through the k-d tree and will perform ray-triangle intersection calculations only on triangles that are contained in the traversed leaves. Many different k-d tree traversing algorithms have been developed in recent years. EM.Terrano's SBR simulation engine uses an improved version of an efficient algorithm called the Recursive Ray Traversal Algorithm [3].
Setting Up the Manhattan Propagation Scene
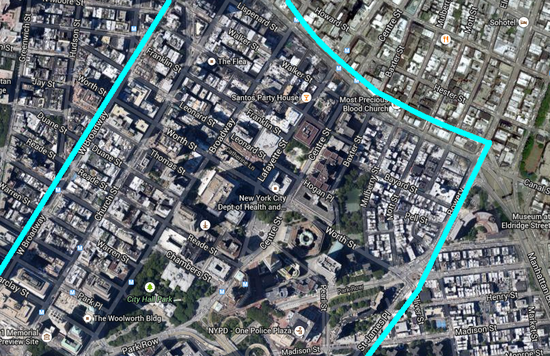
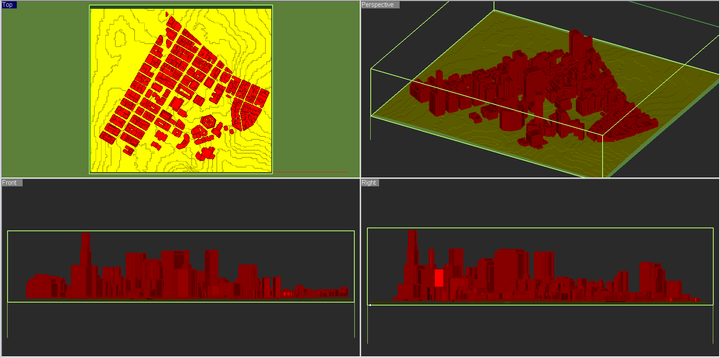
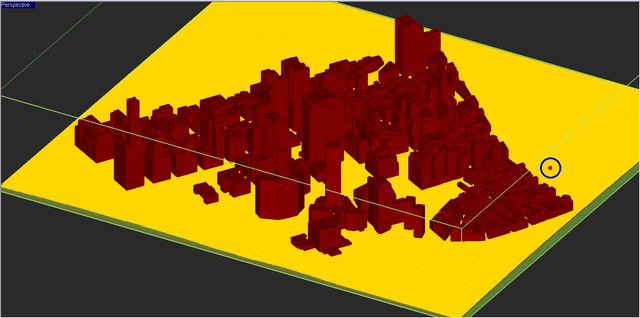
The figure below shows a part of lower Manhattan that will be modeled as a propagation for this project. The real-sized building models are imported from a STEP CAD file, while the terrain is imported from a digital elevation map (DEM) file.
For the sake of simplicity, we assume that all the buildings are made of brick with εr = 4.44 and σ = 0.001S/m. A more complex scene may be constructed by assigning different materials to different buildings. The terrain is assumed to be rocky with εr = 5 and σ = 0.005S/m. The scene involves a total of 614 solid objects of complex shapes with polygonal, curved or composite cross sections.
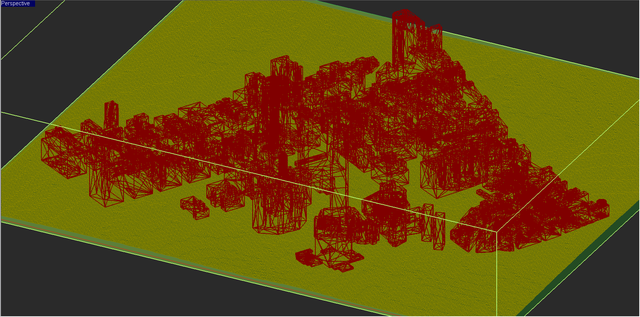
EM.Terrano's mesh generator creates a triangular surface mesh of the buildings as well as the terrain surface. The generated mesh contains a total of 146,205 triangular facets along with 27,357 diffraction edges. When a ray hits an edge, a cone of new diffracted rays are generated and injected into the scene.
EM.Terrano's default transmitter is a vertically polarized half-wave dipole antenna. The default transmitter is placed at x = 1150m and y = 700m, at a height of 30m above the ground elevation at that point. A large rectangular grid of 260 × 240 isotropic receivers is placed 1.5m above the ground elevation that covers the entire scene. A total of 62,400 receivers with an equal spacing of 5m are used to collect the rays in the scene.
SBR Analysis of the Manhattan Scene with a Vertical Dipole Transmitter
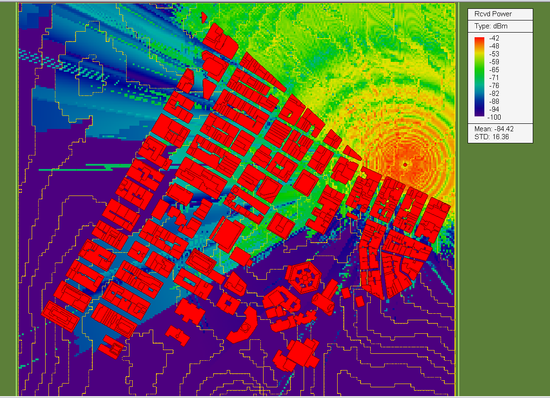
The operating frequency of the SBR simulation is set to f = 2.4GHz. At this frequency, the free-space wavelength is λ0 = 0.125m. Due to the very large size of the propagation scene, we choose a ray angular resolution of 0.1° for this simulation. EM.Terrano uses a special algorithm based on the tessellation of an icosahedron to generate ray tubes with uniform and equal cross sectional areas. With the specified 0.1° angular resolution, this algorithm generates a total of 648,000 initial rays emanating from the location of the transmitter in all directions. The reflected rays are limited to a maximum of 10 bounces. The sensitivity of the receivers is set to -100dBm. This means that if the power of any ray falls below this threshold before reaching a receiver, that ray is terminated in the scene. The figure below shows the computed receiver power coverage map of the propagation scene.
The above figure shows a maximum receiver power of -42dBm. To run a quick sanity check on the simulation results, consider the fact that the transmitter and receivers are placed 30m and 1.5m above the ground elevation, respectively. Therefore, the minimum distance between the transmitter and the line-of-sight (LOS) receivers is Rmin = 28.5m. The default dipole transmitter has a baseband power of 1W (30dBm) and the dipole radiator has a directivity GT of 2.15dB. Under the conjugate match condition, the effective isotropically radiated power of the transmitter is -29.14dBm. The directivity GR of the isotropic receivers is 0dB. If the ground reflection effect is neglected, one can use the Friis formula to get an estimation of the receive power by the closest LOS receiver:
- [math] P_R = P_T G_T G_R \left( \frac{\lambda_0}{4\pi R} \right)^2 = 29.14dBm + 20log_{10}\left( \frac{0.125}{4\pi(28.5)} \right) \approx -40dBm[/math]
The table below summarizes the computational statistics associated with the SBR simulation performed earlier:
| Operating Frequency | 2.4GHz |
| Free-Space Wavelength | λ0 = 0.125m |
| Total Domain Area Size | 1.3km × 1.2km (10,400λ0 × 9,600λ0) |
| Total Number of Buildings | 914 |
| Total Number of Facets | 146,205 |
| Total Number of Edges | 27,357 |
| Total Number of Transmitted Rays | 648,000 |
| Total Number of Receivers | 62,400 |
| Total Number of k-d Tree Nodes | 125,038 |
The SBR simulation was performed on an ASUS laptop computer with an Intel i7-4860 HQ processor with eight cores. The laptop features 32GB RAM memory. Due to the complexity of the geometry of many buildings, the mesh generation task took a sizable amount of time. The table below shows the time spent by the CPU for the mesh generation and SBR ray tracing portions of the total simulation time:
| Simulation Step | Computation Time |
| Facet Mesh Generation | 80s |
| SBR Ray Tracing | 160s |
| Total | 240s |
Using a Directional Yagi-Uda Array
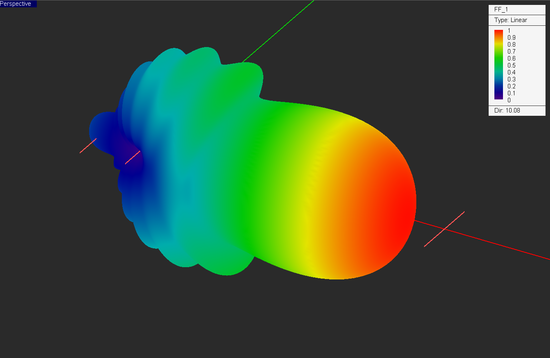
A vertical dipole has a fairly omni-directional far-field radiation pattern along the azimuth direction. Next, we will use a directional antenna array as the transmitter. For this purpose, we choose a horizontal end-fire Yagi-Uda dipole array with a reflector, an exciter and 10 director elements. The individual dipole elements are Y-directed and the array's linear axis is oriented along the X-axis. The design of the Yagi-Uda dipole array is discussed in detail in EM.Libera Tutorial Lesson 2: Designing A Yagi-Uda Dipole Array. The figure below shows the 3D far-field radiation pattern of 12-element Yagi-Uda array at an operating frequency of 2.4GHz.
The above radiation pattern was computed using EM.Libera, EM.Cube's MoM3D computational module. The φ and θ components of the far-zone electric fields in the standard spherical coordinate system are stored in an ASCII data file with a ".RAD" file extension. With an original angular resolution of 1°, the data file contains a total of 361 × 181 = 65,341 rows containing the real and imaginary parts of the complex-valued Eθ and Eφ field components. This provides a fully polarimetric representation of the source's outgoing fields, which are then picked up and traced by EM.Terrano's fully coherent and 3D-polarimetric SBR solver. Note that the complexity of the radiation pattern data file does not add any computational overhead to the SBR simulation. The figure below shows the received power coverage map of the Manhattan scene with an X-directed horizontal Yagi-Uda array. You can visibly see the directionality of the pattern of the transmitter from the coverage map in the area below the transmitter. Also note that the maximum received power in this case is -37dBm, which is 7dB larger than the previous case with a vertical dipole transmitter. This increase is accounted for by the greater directivity (D0 = 10dB) of the transmitter antenna, and hence the larger transmitted EIRP.
EM.Terrano allows the user to rotate an imported far-field radiation pattern about the three principal coordinate axes. Next, we rotate the radiation pattern of the Yagi-Uda array by 135° and run a new SBR simulation of the propagation scene. The results are shown in the figure below. Note the deeper wave penetration into the urban canyon as well as the strong reflection from the blocks of buildings into the open area behind the transmitter.
Moving the Transmitter into a Dense Area
Next, we moved the transmitter with the rotated Yagi-Uda array into a denser area and placed it at x = 900m and y = 450mm as shown in the figure below.
Instead of running a single-frequency SBR analysis, this time we ran a frequency sweep of the propagation scene over the frequency range [1.5GHz, 2.5GHz]. A frequency step of 100MHz was chosen, hence, a total of 11 frequency samples. The geometrical optic (GO) part of the simulation is the same for all frequency samples except for the fact that the reflection coefficients are at the building specular points are frequency-dependent. Diffraction coefficients are frequency-dependent, too. EM.Terrano first determines all the optical paths in the scene using the k-d tree algorithms. Then, it calculates the reflection and diffraction coefficients at each frequency sample and computes the field components and received power at the location of each receiver. As a result, EM.Terrano's frequency sweeps are extremely fast. The figures below show the received power coverage maps of the propagation scene with a rotated horizontal Yagi-Uda array at three different frequencies: f = 1.5GHz, 2GHz and 2.5GHz. The color-coded intensity scale is identical for all three plots. As you would have expected, the maximum received power level drops as the operating frequency is increased.
The table below shows the computation time of different stages of the SBR sweep simulation:
| Simulation Step | Computation Time |
| Facet Mesh Generation | 80s |
| SBR Ray Tracing | 160s |
| Frequency Computations | 90s |
| Total | 330s |
References
[1] H. Ling, R. C. Chou, and S. W. Lee, "Shooting and bouncing rays: Calculating the RCS of an arbitrarily shaped cavity," IEEE Trans. Antennas Propagat., vol. 37, no. 2, pp. 194–205, 1989.
[2] S-H Chen and S-K Jeng, "An SBR/image approach for radio wave propagation in indoor environments with metallic furniture," IEEE Trans. Antennas & Propagat., vol. 45, No. 1, pp. 98-106, 1997.
[3] M. Hapala and V. Havran. Review: Kd-tree traversal algorithms for ray tracing. Computer Graphics Forum, 30(1):199213, March 2011.
