EM.Libera Tutorial Lesson 2: Designing A Yagi-Uda Dipole Array
Contents
- 1 What You Will Learn
- 2 Getting Started
- 3 The Yagi-Uda Array Design
- 4 Constructing the Array Geometry
- 5 Examining the Source, Observables & Mesh Settings
- 6 Running a WMOM Analysis of the Yagi-Uda Array
- 7 Running a Parametric Sweep of the Number of Director Elements
- 8 Analyzing the Array Directivity Data
What You Will Learn
In this tutorial you will use a wizard to build and analyze a multi-element Yagi-Uda wire antenna array. You will learn how to perform a parametric sweep simulation using the project's design variables.
![]() Back to EM.Libera Tutorial Gateway
Back to EM.Libera Tutorial Gateway
![]() Download projects related to this tutorial lesson
Download projects related to this tutorial lesson
Getting Started
Open the EM.Cube application and switch to EM.Libera. Start a new project with the following parameters:
The Yagi-Uda Array Design
A Yagi-Uda array is an end-fire array, which is typically made of an exciter element, a reflector element and several director elements. The lengths of all the elements vary around a half wavelength. The following table shows the electrical lengths and spacing of a typical design:
| Element | Length | Distance from Exciter |
|---|---|---|
| Exciter | 0.47λ0 | 0 |
| Reflector | 0.5λ0 | 0.25λ0 |
| Director | 0.406λ0 | 0.34λ0 |
In the above design, the spacing between the director elements is uniform and equal to 0.34λ0. The radius of all wires is 0.003λ0. In this project, f0 = 2.4GHz, and the free-space wavelength is λ0 = 125mm.
Constructing the Array Geometry
Click on the Yagi-Uda Wizard ![]() button of the Wizard Toolbar or select the menu item Tools → Antenna Wizards → Yagi-Uda Array.
button of the Wizard Toolbar or select the menu item Tools → Antenna Wizards → Yagi-Uda Array.
Keep the default settings for Array Direction, Dipole Polarization, and No. Elements as X, Y, and 5, respectibely, in the "Yagi Wizard Quick Settings" dialog window.
The geometry of a 7-element Yagi-Uda dipole array appears at the center of the project workspace.
Three items are added under a thin wire group called "YAGI" as follows:
- Exciter: a line object
- Reflector: a line object
- Director_array: an array of line objects
The line array contains five equally spaced elements. Select "Director_array" in the navigation tree, right-click on its name and select Properties... from the contextual menu to open the array dialog.
As you can see from the array properties, Nx ≠ 1 and Ny = Nz = 1, representing an X-directed linear array. If you click the Primitive button of the array dialog, another property dialog opens up which belongs to the original geometric object the wizard used to create the array object.
Open the Variable Dialog and review all the variables used in the definition of the Yagi-Uda array.
Examining the Source, Observables & Mesh Settings
The wizard placed a wire gap source at the center of the "Exciter" line object:
It also initiated a default current distribution observable called "CD_1" and a far-field radiation pattern observable called "FF_1" with 1° theta and phi angle increments. Open the radiation pattern dialog by right-clicking on "FF_1" in the navigation tree and selecting Properties... from the contextual menu. Check the boxes labeled Half Power Beam Width and Front-to-Back Ratio in the section titled "Additional Radiation Characteristics".
The wizard also set the mesh density equal to an unusually high value of 100 Cells per effective wavelength. Open the mesh settings dialog and verify this. The performance of the Yagi-Uda array greatly depends on the precision of the lengths and spacing of its elements. Considering the fact that these lengths and spacings are fairly close to each other, a high resolution mesh is naturally expected.
Running a WMOM Analysis of the Yagi-Uda Array
Run a single-frequency Wire MoM analysis of the Yagi-Uda array. Note that even though you have a multi-element antenna array, your structure is indeed one-port. At the end of the simulation, the port characteristics of the array are reported as follows:
S11: -0.066842 + 0.022391j
S11(dB): -23.037127
Y11: 0.015227 - 0.000685j
Z11: 65.539975 + 2.949646j
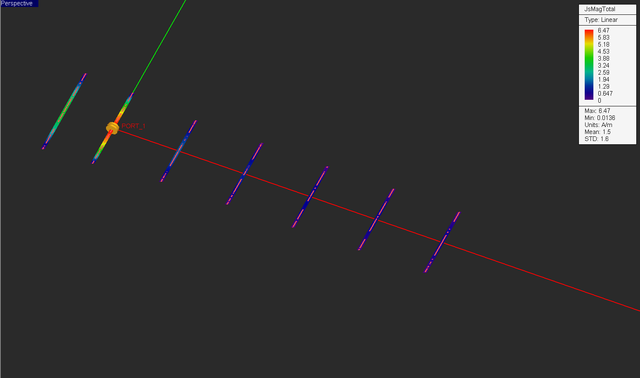
Visualize the current distribution on the array structure. From the figure below, you can see that the exciter and reflector elements are much hotter than the director elements.
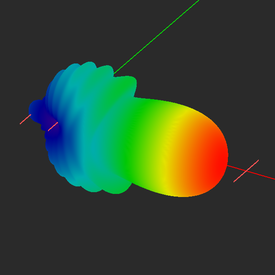
Visualize the 3D radiation pattern of the Yagi-Uda array. The directivity of the antenna array is computed to be D0 = 7.461.
Open the data manager and plot the data files "FF_1_PATTERN_Polar_XY.ANG" and "FF_1_PATTERN_Polar_ZX.ANG" as shown in the figures below. These are the polar graphs of the radiation patterns at the principal XY and ZX planes, respectively.
You can also view the contents of any data file in the data manager by selecting its name and clicking the View button of this dialog. The table below shows some of the computed radiation characteristics of your Yagi-Uda array.
| Data File Name | Radiation Characteristic | Value |
|---|---|---|
| HPBW_XY.DAT | Half power beam width in XY palne | 53.86° |
| HPBW_ZX.DAT | Half power beam width in ZX palne | 67.77° |
Running a Parametric Sweep of the Number of Director Elements
In the last part of this tutorial lesson, you are going to increase the number of director elements and see its effect on the array characteristics. In a sweep simulation, one or more parameters are varied, and the simulation engine is run for each parameter set. Open the Simulation Run dialog and choose the Parametric Sweep option from the Simulation Mode drop-down list. Click on the Settings button next to this drop-down list to open the Parametric Sweep Settings dialog.
The sweep variables list is initially empty. On the left side of this dialog, you see a list of all the available independent variables. Note that out of all the array-related variables you saw earlier in the variables dialog, only one called "n_direct" is listed here. This is the number of director elements in the Yagi-Uda array, and it is an independent variable. All the other array-related variables such as wire lengths, spacings, etc. are dependent variables whose definitions involve another variable called "lambda0_unit".
Select "n_direct" from the left table and use the right arrow --> button to move it to the right table. Another dialog titled "Define Sweep Variable" opens up. You have to set the start, stop and step values of your sweep variable. By default, the sweep variable is of uniform type. Enter 5, 13, and 1 for the start, stop and step values, respectively. This will create a value list of {5, 6, 7, 8, 9, 10, 11, 12, 13}.
Close the sweep variable dialog and return to the parametric sweep settings dialog.
Click on the OK button to close the parametric sweep settings dialog and return to the simulation run dialog. Run the sweep simulation. It may take a while as a total of nine individual WMOM simulations must be completed. At the end of the parametric sweep, you will see a total of nine 3D radiation pattern plots in the navigation tree. The figures below shows some of these plots.
Analyzing the Array Directivity Data
Open the data manager and plot the data file "FF_D0_Sweep.DAT" in EM.Grid. You should see a graph like the figure below. It shows the variation of the directivity (D0) of the array as a function of the number of director elements. An almost linear variation is observed.
Next, while still in the data manager, view the contents of the data file "FF_D0_Sweep.DAT" in a spreadsheet using the View button of this dialog.


