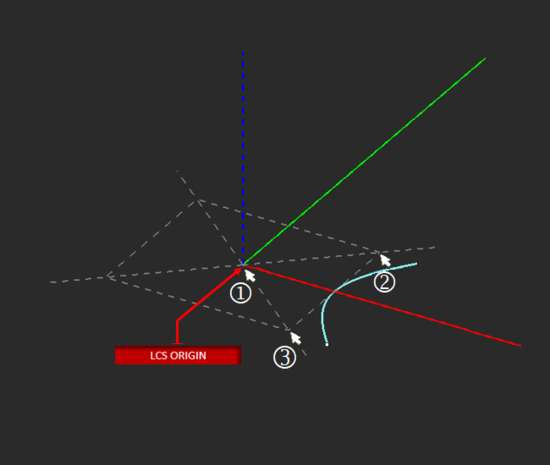
Glossary of EM.Cube's Standard Geometric Objects
Contents
- 1 Box Tool
- 2 Circle Strip Tool
- 3 Circle Tool
- 4 Cone Tool
- 5 Curve Generator
- 6 Cylinder Tool
- 7 Ellipse Strip Tool
- 8 Ellipsoid Tool
- 9 Fractal Tree Tool
- 10 Helix Tool
- 11 Hyperbola Tool
- 12 Line Tool
- 13 NURBS Curve Tool
- 14 NURBS Strip Tool
- 15 Parabola Tool
- 16 Point Tool
- 17 Polyline Tool
- 18 Polystrip Tool
- 19 Pyramid Tool
- 20 Radial Strip Tool
- 21 Rectangle Strip Tool
- 22 Regular Polygon Tool
- 23 Solid Generator
- 24 Sphere Tool
- 25 Spiral Curve Tool
- 26 Spiral Strip Tool
- 27 Super-Quadratic Curve Tool
- 28 Surface Generator
- 29 Taper Strip Tool
- 30 Torus Tool
- 31 Triangle Strip Tool
Box Tool
MENU: Object → Solid → Box
TO DRAW A BOX:
- Activate the Box Tool.
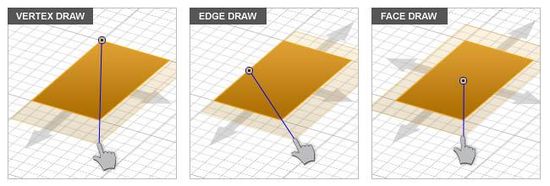
- Left-click to establish the first bottom vertex.
- Drag the mouse away from the first vertex to establish the desired base plane area. Left-click a second time to establish the opposite bottom vertex.
- Drag the mouse up and away from the base plane to set the desired height. Left-click a third time to complete the box.
PYTHON COMMAND: box(label,x0,y0,z0,base_x,base_y,height[,cap_top,cap_bottom])
BOX PARAMETERS
| Parameter Name | Value Type | Units | Default Value | Notes |
|---|---|---|---|---|
| LCS_X | real numeric | project units | - | X-coordinates of base |
| LCS_Y | real numeric | project units | - | Y-coordinates of base |
| LCS_Z | real numeric | project units | - | Z-coordinates of base |
| rot_X | real numeric | degrees | - | local rotation about X-axis |
| rot_Y | real numeric | degrees | - | local rotation about Y-axis |
| rot_Z | real numeric | degrees | - | local rotation about Z-axis |
| size_X | real numeric | project units | - | dimension along X-axis |
| size_Y | real numeric | project units | - | dimension along Y-axis |
| size_Z | real numeric | project units | - | dimension along Z-axis |
| fix_center_X | Boolean | - | TRUE | fixes X-coordinate of base |
| fix_center_Y | Boolean | - | TRUE | fixes Y-coordinate of base |
| cap_top | Boolean | - | TRUE | places a cap at top |
| cap_bottom | Boolean | - | TRUE | places a cap at bottom base |
Circle Strip Tool
MENU: Objects → Surfaces → Circle Strip
TO DRAW A CIRCLE STRIP:
- Activate the Circle Strip Tool.
- Left-click to define the origin
- Drag the mouse away from the origin to establish the desired radius. Left-click a second time to complete the circle strip.
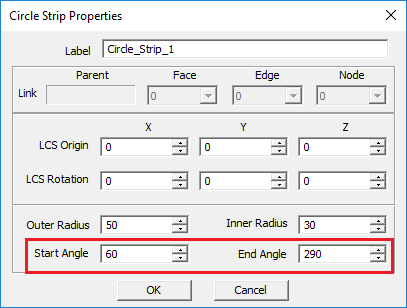
PYTHON COMMAND: circ_strip(label,x0,y0,z0,outer_radius,inner_radius[,start_angle,end_angle])
CIRCLE STRIP PARAMETERS
| Parameter Name | Value Type | Units | Default Value | Notes |
|---|---|---|---|---|
| LCS_X | real numeric | project units | - | X-coordinates of base |
| LCS_Y | real numeric | project units | - | Y-coordinates of base |
| LCS_Z | real numeric | project units | - | Z-coordinates of base |
| rot_X | real numeric | degrees | - | local rotation about X-axis |
| rot_Y | real numeric | degrees | - | local rotation about Y-axis |
| rot_Z | real numeric | degrees | - | local rotation about Z-axis |
| outer_radius | real numeric | project units | - | circle's outer radius |
| inner_radius | real numeric | project units | 0 | inner radius creating a ring object |
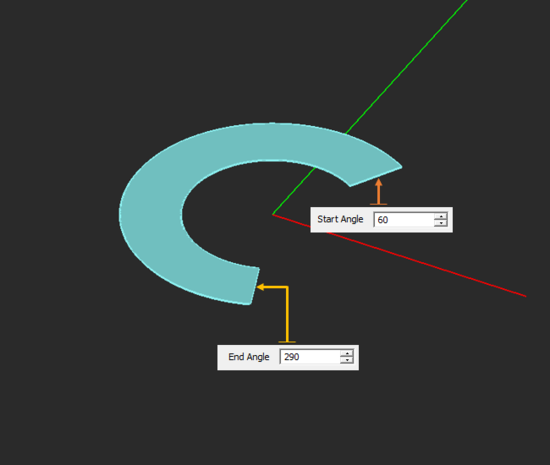
| start_angle | real numeric | degrees | 0 | start azimuth angle |
| end_angle | real numeric | degrees | 360 | end azimuth angle |
Circle Tool
MENU: Object → Curve → Circle
TO DRAW A CIRCLE:
- Activate the Circle Tool.
- Left-click at the desired location on the active grid to establish the origin.
- Drag your mouse away from the origin to set the desired radius.
- Left click a second time to complete the circle.
PYTHON COMMAND: circle(label,x0,y0,z0,radius,start_angle,end_angle)
CIRCLE PARAMETERS
| Parameter Name | Value Type | Units | Default Value | Notes |
|---|---|---|---|---|
| LCS_X | real numeric | project units | - | X-coordinates of base |
| LCS_Y | real numeric | project units | - | Y-coordinates of base |
| LCS_Z | real numeric | project units | - | Z-coordinates of base |
| rot_X | real numeric | degrees | - | local rotation about X-axis |
| rot_Y | real numeric | degrees | - | local rotation about Y-axis |
| rot_Z | real numeric | degrees | - | local rotation about Z-axis |
| radius | real numeric | project units | - | - |
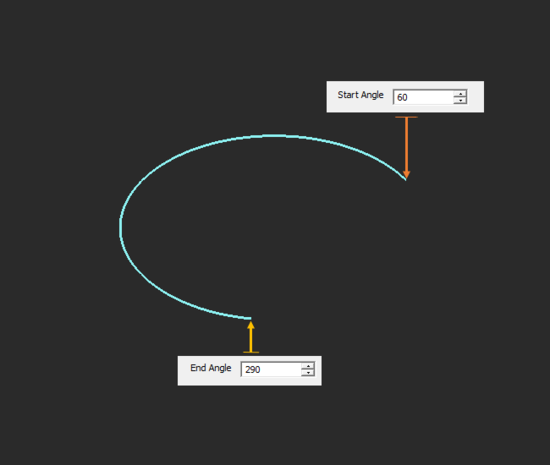
| start_angle | real numeric | degrees | 0 | start azimuth angle |
| end_angle | real numeric | degrees | 360 | end azimuth angle |
Cone Tool
MENU: Object → Solid → Cone
TO DRAW A CONE:
- Activate the Cone Tool.
- Left-click to establish the cone's base plane origin.
- Drag away from the origin to define the base plane's radius. Left-click a second time to define the base plane.
- Drag the mouse away from the base plane to establish the height. Left-click a third time to complete the cone.
PYTHON COMMAND: cone(label,x0,y0,z0,base_radius,height[,top_radius,start_angle,end_angle,cap_top,cap_bottom])
CONE PARAMETERS
| Parameter Name | Value Type | Units | Default Value | Notes |
|---|---|---|---|---|
| LCS_X | real numeric | project units | - | X-coordinates of base |
| LCS_Y | real numeric | project units | - | Y-coordinates of base |
| LCS_Z | real numeric | project units | - | Z-coordinates of base |
| rot_X | real numeric | degrees | - | local rotation about X-axis |
| rot_Y | real numeric | degrees | - | local rotation about Y-axis |
| rot_Z | real numeric | degrees | - | local rotation about Z-axis |
| base_radius | real numeric | project units | - | - |
| top_radius | real numeric | project units | 0 | - |
| height | real numeric | project units | - | - |
| start_angle | real numeric | degrees | 0 | start azimuth angle |
| end_angle | real numeric | degrees | 360 | end azimuth angle |
| cap_top | Boolean | - | TRUE | places a cap at top |
| cap_bottom | Boolean | - | TRUE | places a cap at bottom base |
Curve Generator
MENU: Object → Curve → Curve Generator
TO DRAW A PARAMETRIC CURVE:
- Activate the Curve Generator Tool.
- Left-click to establish the location of the new parametric curve. A default oblique line appears in the project workspace.
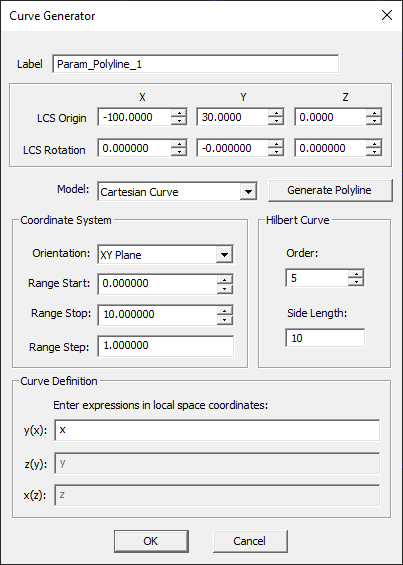
- The curve generator dialog opens up on the lower left corner of the screen. You have three options for Model type: Cartesian Curve, Polar Curve or Parametric Curve. The default option is the Cartesian curve.
- In the case of a Cartesian curve, you also have three options for Orientation: XY, YZ or ZX planes. With the XY plane orientation, the Cartesian curve is expressed as y = f(x). With the YZ plane orientation, the Cartesian curve is expressed as z = f(y). With the ZX plane orientation, the Cartesian curve is expressed as x = f(z).
- Enter the start, stop and step values for the range of the coordinate variable in the selected orientation plane.
- Enter a mathematical expression in terms of the coordinate variable in the selected orientation plane for the definition of the Cartesian curve.
- In the case of a polar curve, the radial coordinate is expressed as a function of the polar angle t: r = r(t).
- In the case of a parametric curve, the x, y and z coordinates are expressed as three separate functions of the parameter t: x(t), y(t), z(t).
- For a polar or parametric curve, enter the start, stop and step values for the range of the variable t.
- Enter the defining expression(s) for the curve.
- Make sure to click the OK button of the dialog to complete the curve construction.
NOTES, SPECIAL CASES OR EXCEPTIONS: You can always edit and modify a parametric curve after you first create it in the curve generator. The property dialog of a parametric curve object is indeed the curve generator itself, where you can change the parameter values or the defining expression(s). All the curves created by the curve generator are of the polyline type.
PYTHON COMMAND: param_curve(label,x0,y0,z0,model,orientation,start,stop,step,function[,y(t),z(t)])
PARAMETRIC CURVE PARAMETERS
| Parameter Name | Value Type | Units | Default Value | Notes |
|---|---|---|---|---|
| LCS_X | real numeric | project units | - | X-coordinates of the surface |
| LCS_Y | real numeric | project units | - | Y-coordinates of the surface |
| LCS_Z | real numeric | project units | - | Z-coordinates of the surface |
| rot_X | real numeric | degrees | 0 | local rotation about X-axis |
| rot_Y | real numeric | degrees | 0 | local rotation about Y-axis |
| rot_Z | real numeric | degrees | 0 | local rotation about Z-axis |
| model | three options: Cartesian, polar or parametric | - | Cartesian | the curve definition type |
| orientation | three options: XY, YZ or ZX | - | XY | the coordinate plane in which the Cartesian curve is drawn (only for Cartesian curve) |
| start | real numeric | project units | 0 | start value of range of the coordinate variable |
| stop | real numeric | project units | 10 | stop value of range of the coordinate variable |
| step | integer numeric | project units | 1 | step value of range of the coordinate variable |
| function | text string | - | x | mathematical expression in the local coordinate variable |
| y(t) | text string | - | t | mathematical expression in the variable t (only for parametric curve) |
| z(t) | text string | - | t | mathematical expression in the variable t (only for parametric curve) |
Cylinder Tool
MENU: Object → Solid → Cylinder
TO DRAW A CYLINDER:
- Activate the Cylinder Tool.
- Left-click to establish the center of the bottom base.
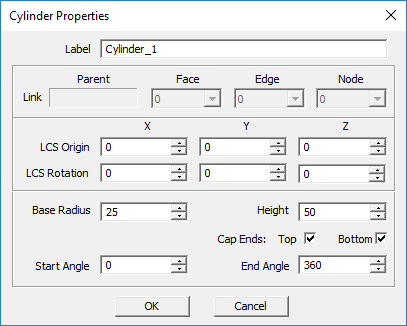
- Drag the mouse away from the origin to create the desired base radius. Left-click a second time to establish the cylinder's base.
- Drag the mouse up and away from the active work plane to establish the cylinder's height. Left-click a third time to complete the cylinder.
PYTHON COMMAND: cylinder(label,x0,y0,z0,radius,height[,start_angle,end_angle,cap_top,cap_bottom])
CYLINDER PARAMETERS
| Parameter Name | Value Type | Units | Default Value | Notes |
|---|---|---|---|---|
| LCS_X | real numeric | project units | - | X-coordinates of base |
| LCS_Y | real numeric | project units | - | Y-coordinates of base |
| LCS_Z | real numeric | project units | - | Z-coordinates of base |
| rot_X | real numeric | degrees | - | local rotation about X-axis |
| rot_Y | real numeric | degrees | - | local rotation about Y-axis |
| rot_Z | real numeric | degrees | - | local rotation about Z-axis |
| base_radius | real numeric | project units | - | - |
| height | real numeric | project units | - | - |
| start_angle | real numeric | degrees | 0 | start azimuth angle |
| end_angle | real numeric | degrees | 360 | end azimuth angle |
| cap_top | Boolean | - | TRUE | places a cap at top |
| cap_bottom | Boolean | - | TRUE | places a cap at bottom base |
Ellipse Strip Tool
MENU: Object → Surface → Ellipse Strip
TO DRAW AN ELLIPSE STRIP:
- Activate the Ellipse Strip Tool.
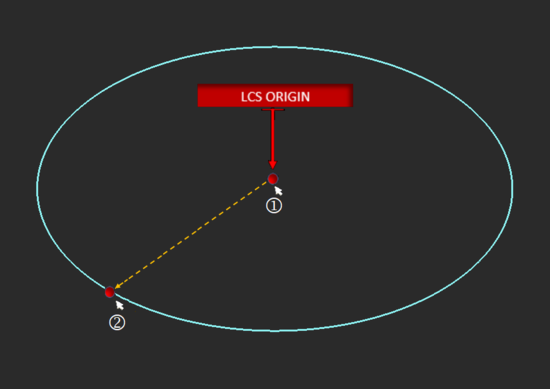
- Left-click to establish the X/Y axis origin.
- Drag the mouse away from the origin to the desired location. Left-click a second time to create the ellipse.
PYTHON COMMAND: ellipse_strip(label,x0,y0,z0,radius_x,radius_y[,start_angle,end_angle])
ELLIPSE STRIP PARAMETERS
| Parameter Name | Value Type | Units | Default Value | Notes |
|---|---|---|---|---|
| LCS_X | real numeric | project units | - | X-coordinates of base |
| LCS_Y | real numeric | project units | - | Y-coordinates of base |
| LCS_Z | real numeric | project units | - | Z-coordinates of base |
| rot_X | real numeric | degrees | - | local rotation about X-axis |
| rot_Y | real numeric | degrees | - | local rotation about Y-axis |
| rot_Z | real numeric | degrees | - | local rotation about Z-axis |
| radius_X | real numeric | project units | - | radius along X-axis |
| radius_Y | real numeric | project units | - | radius along Y-axis |
| start_angle | real numeric | degrees | 0 | start azimuth angle |
| end_angle | real numeric | degrees | 360 | end azimuth angle |
| fix_center_X | Boolean | - | TRUE | fixes X-coordinate of base |
| fix_center_Y | Boolean | - | TRUE | fixes Y-coordinate of base |
Ellipsoid Tool
MENU: Object → Solid → Ellipsoid
TO DRAW AN ELLIPSOID:
- Activate the Ellipsoid Tool.
- Left-click to define the first X-radius anchor point.
- Drag the mouse to the desired length. left-click a second time to define the ending X-radius anchor point.
- Drag the mouse away from the X radius to establish the desired Y-radius. Left-click a third time to define the Y radius.
- Drag the mouse away from the active plane to define the Z radius. Left-click a fourth time to complete the ellipsoid.
PYTHON COMMAND: ellipsoid(label,x0,y0,z0,radius_x,radius_y,radius_z[,start_angle,end_angle])
ELLIPSOID PARAMETERS
| Parameter Name | Value Type | Units | Default Value | Notes |
|---|---|---|---|---|
| LCS_X | real numeric | project units | - | X-coordinates of base |
| LCS_Y | real numeric | project units | - | Y-coordinates of base |
| LCS_Z | real numeric | project units | - | Z-coordinates of base |
| rot_X | real numeric | degrees | - | local rotation about X-axis |
| rot_Y | real numeric | degrees | - | local rotation about Y-axis |
| rot_Z | real numeric | degrees | - | local rotation about Z-axis |
| radius_X | real numeric | project units | - | - |
| radius_Y | real numeric | project units | - | - |
| radius_Z | real numeric | project units | - | - |
| start_angle | real numeric | degrees | 0 | start azimuth angle |
| end_angle | real numeric | degrees | 360 | end azimuth angle |
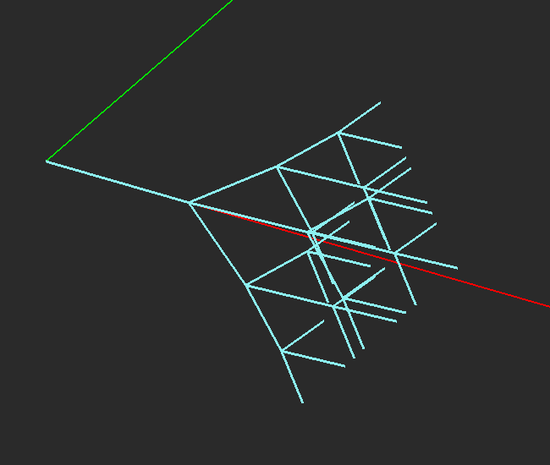
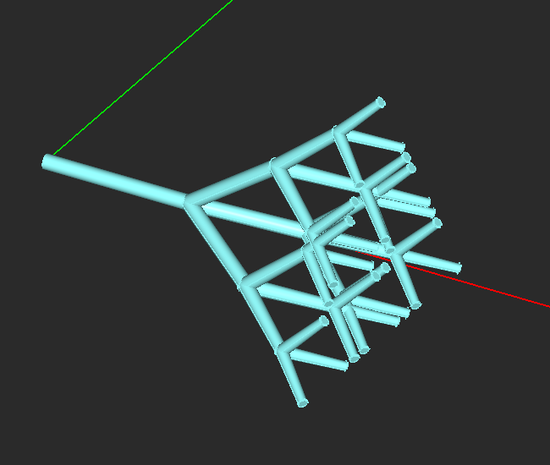
Fractal Tree Tool
MENU: Object → Special → Fractal Tree
TO DRAW A FRACTAL TREE:
- Activate the Fractal Tree Tool.
- Left-click to establish the location of the fractal tree. A default horizontal fractal tree appears in the project workspace.
- The fractal dialog opens up on the lower right corner of the screen. You have two options: fractal tree with linear or cylindrical branches. You can also set the number of fractal levels.
- Make sure to click the OK button of the dialog to complete the fractal construction.
NOTES, SPECIAL CASES OR EXCEPTIONS: The parameter Gen. Factor determines how many new next-level branches are generated at the end of each branch. Separation Angle sets the angle between each pair of branches at each node. The Prune Factor determines what percentage of branches are removed randomly at each node. With a default zero prune factor, all the branches are kept. The parameter Thickness represents the diameter of the main branch in the case of a cylinder key object. The parameter Thickness Factor determines the tapering of each cylindrical branch from its start point to the end point. A zero thickness factor means no branch tapering.
You can change the coordinates of the LCS of a fractal tree or its rotation angle. From the fractal dialog, you can also access the properties of the key object by clicking the Edit Primitive... button of this dialog.
| |
Fractal tree operations are usually very time consuming especially when the key object type is a cylinder. Please be patient while EM.Cube is running fractal tree creation or edit operations. |
PYTHON COMMAND: fractal_tree(label,x0,y0,z0,key_type,key_size,n_level,sep_angle,n_gen,prune_factor,thickness,thick_factor)
FRACTAL TREE PARAMETERS
| Parameter Name | Value Type | Units | Default Value | Notes |
|---|---|---|---|---|
| LCS_X | real numeric | project units | - | X-coordinates of base |
| LCS_Y | real numeric | project units | - | Y-coordinates of base |
| LCS_Z | real numeric | project units | - | Z-coordinates of base |
| rot_X | real numeric | degrees | - | local rotation about X-axis |
| rot_Y | real numeric | degrees | - | local rotation about Y-axis |
| rot_Z | real numeric | degrees | - | local rotation about Z-axis |
| key_object_type | Line or Cylinder | - | Line | - |
| level_count | integer numeric | - | 3 | number of fractal levels |
| separation_angle | real numeric | degrees | 30 | angle between two adjacent branches |
| generation_factor | integer numeric | - | 3 | Number of new branches generated at each node |
| prune_factor | real numeric | - | 0 | A number between 0 and 1 representing the percentage of branches randomly deleted |
| thickness | real numeric | project units | 1 | diameter of branches |
| thickness_factor | real numeric | - | 0.2 | A number between 0 and 1 representing the percentage of tapering of each cylindrical branch upward |
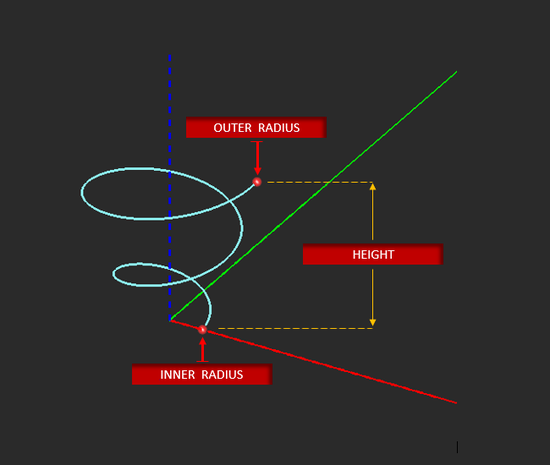
Helix Tool
MENU: Object → Curve → Helix
TO DRAW A HELIX:
- Activate the Helix Tool.
- Left-click to establish the origin of the inner-radius.
- Drag away from the origin to expand the inner radius, (toward it to contract the inner radius).
- Left-click a second time to set the inner radius and to establish the anchor point from which you will set the height of the helix.
- Drag your cursor "up" and away from the second anchor point to increase the height of the helix.
- Left-click a third time to complete the helix.
NOTES, SPECIAL CASES OR EXCEPTIONS: You can define a helix curve with different values for Inner Radius and Outer Radius, which make the curve expanding or shrinking. The Height parameter establishes the elevation of the end point of the helix with respect to start point.
PYTHON COMMAND: helix(label,x0,y0,z0,radius_inner,radius_outer,height,nturns,helix_dir)
HELIX PARAMETERS
| Parameter Name | Value Type | Units | Default Value | Notes |
|---|---|---|---|---|
| LCS_X | real numeric | project units | - | X-coordinates of base |
| LCS_Y | real numeric | project units | - | Y-coordinates of base |
| LCS_Z | real numeric | project units | - | Z-coordinates of base |
| rot_X | real numeric | degrees | - | local rotation about X-axis |
| rot_Y | real numeric | degrees | - | local rotation about Y-axis |
| rot_Z | real numeric | degrees | - | local rotation about Z-axis |
| inner_radius | real numeric | project units | same as outer radius | - |
| outer_radius | real numeric | project units | - | - |
| height | real numeric | project units | - | - |
| turns | integer numeric | project units | 2 | number of spiral turns |
| ccw | Boolean | - | TRUE | if TRUE, creates counterclockwise right-handedness |
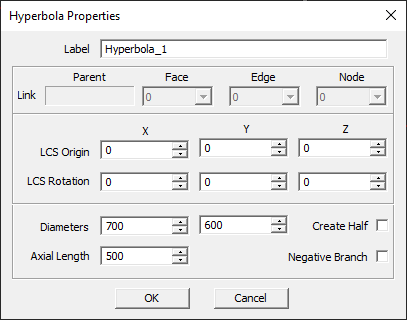
Hyperbola Tool
MENU: Object → Curve → Hyperbola
TO DRAW A HYPERBOLA:
- Activate the Hyperbola Tool.
- Left-click to define the X-radius origin. Construction guides will appear to aid in the drawing process.
- Drag the mouse away from the origin to establish the desired X-radius. Left-click a second time.
- To establish the Y-radius and the hyperbola's leg length, drag the mouse to the desired location and left-click to complete the Hyperbola.
NOTES, SPECIAL CASES OR EXCEPTIONS: Checking the box labeled Neg. Branch creates the opposite branch of the hyperbola curve. Checking the box labeled Create Half bisects the hyperbola and removes its bottom half. You can revolve the resulting curve to create a hyperboloid.
PYTHON COMMAND: hyperbola(label,x0,y0,z0,diam_x,diam_y,axial_length,half_only)
HYPERBOLA PARAMETERS
| Parameter Name | Value Type | Units | Default Value | Notes |
|---|---|---|---|---|
| LCS_X | real numeric | project units | - | X-coordinates of base |
| LCS_Y | real numeric | project units | - | Y-coordinates of base |
| LCS_Z | real numeric | project units | - | Z-coordinates of base |
| rot_X | real numeric | degrees | - | local rotation about X-axis |
| rot_Y | real numeric | degrees | - | local rotation about Y-axis |
| rot_Z | real numeric | degrees | - | local rotation about Z-axis |
| diameter_X | real numeric | project units | - | diameter along X-axis |
| diameter_Y | real numeric | project units | - | diameter along Y-axis |
| axial_length | real numeric | project units | - | - |
| create_half | Boolean | - | FALSE | if TRUE, draws one half of one branch only |
| negative_branch | - | FALSE | if TRUE, draws the negative branch only |
Line Tool
MENU: Object → Curve → Line
TO DRAW A LINE:
- Activate the Line Tool.
- left click anywhere on the workplane to begin drawing the line.
- left-click a second time to complete the line.
NOTES, SPECIAL CASES OR EXCEPTIONS: When the check box Lock Center is checked, changing the line's length expands or shrinks it equally from both ends. To create a line perpendicular to the current work plane, hold down the Alt key while dragging the mouse to establish the line's end point.
PYTHON COMMAND: line(label,x0,y0,z0,len[,dir])
LINE PARAMETERS
| Parameter Name | Value Type | Units | Default Value | Notes |
|---|---|---|---|---|
| LCS_X | real numeric | project units | - | X-coordinates of base |
| LCS_Y | real numeric | project units | - | Y-coordinates of base |
| LCS_Z | real numeric | project units | - | Z-coordinates of base |
| rot_X | real numeric | degrees | - | local rotation about X-axis |
| rot_Y | real numeric | degrees | - | local rotation about Y-axis |
| rot_Z | real numeric | degrees | - | local rotation about Z-axis |
| length | real numeric | project units | - | - |
| fix_center | Boolean | - | FALSE | fixes midpoint coordinates |
NURBS Curve Tool
MENU: Object → Curve → NURBS
TO DRAW A NURBS CURVE:
- Activate the NURBS Curve Tool.
- Click anywhere on the active work plane to create nodes. The contour of the NURBS Curve is rendered as soon as the second node is defined. A NURBS Curve must have at least two nodes.
- Create as many nodes as you want. You can finish the drawing either by double-clicking on the last node or first creating the last node and pressing the keyboard's Enter key.
- The NURBS Curve can be closed at any time using the keyboard shortcut C. This connects the last drawn node to the first.
NOTES, SPECIAL CASES OR EXCEPTIONS: If a NURBS Curve object is originally drawn as an open curve, you can turn it into a closed one by placing a check mark in the box labeled Close Curve. The property dialog of a NURBS Curve object lists the individual nodes and their coordinates ordered by the node ID. You can select and highlight each node and change its coordinates using the Edit button of the dialog. You can also delete each node using the Delete key or insert a new node between the selected node and its next node using the Insert key. The new node is placed at the midpoint between the selected node and the node having the next ID number.
PYTHON COMMAND: nurbs_curve(label,(x0,y0,z0),(x1,y1,z1) ... )
NURBS Strip Tool
MENU: Object → Surface → NURBS Strip
TO DRAW A NURBS STRIP:
- Activate the NURBS Strip Tool.
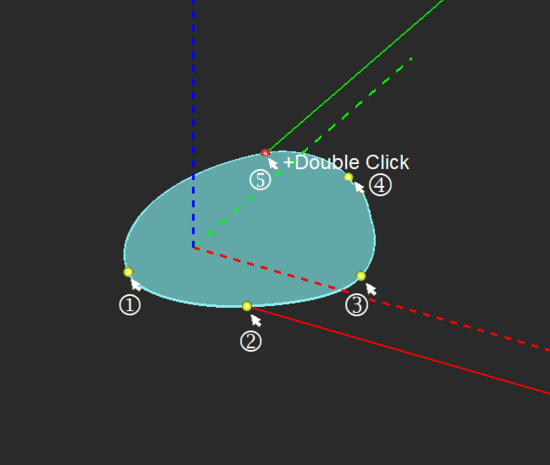
- Click anywhere on the active work plane to create nodes. The contour of the NURBS strip is rendered as soon as the third node is defined. A NURBS Strip must have at least three nodes.
- Create as many nodes as you want. You can finish the drawing either by double-clicking on the last node or first creating the last node and pressing the keyboard's Enter key.
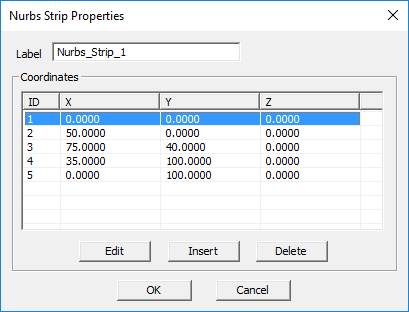
NOTES, SPECIAL CASES OR EXCEPTIONS: The property dialog of a NURBS strip object lists the individual nodes and their coordinates ordered by the node ID. You can select and highlight each node and change its coordinates using the Edit button of the dialog. You can also delete each node using the Delete key or insert a new node between the selected node and its next node using the Insert key. The new node is placed at the midpoint between the selected node and the node having the next ID number.
PYTHON COMMAND: nurbs_strip(label,(x0,y0,z0),(x1,y1,z1) ... )
Parabola Tool
MENU: Object → Curve → Parabola
TO DRAW A PARABOLA:
- Activate the Parabola Tool.
- Left-click to set the Focal Point.
- Drag away from the focal point and left-click a second time to set the desired Offset.
- Drag and left-click a third time to complete the Parabolic Curve.
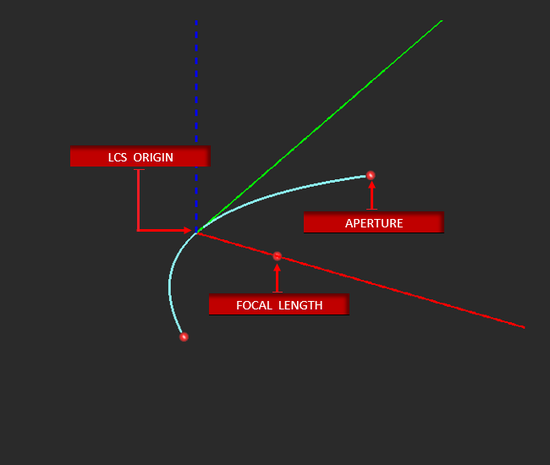
NOTES, SPECIAL CASES OR EXCEPTIONS: The parameters Axial Length and Aperture adjust the size of the opening of the parabola. Changing the value of either one automatically adjusts the value of the other. Checking the box labeled Create Half bisects the parabola and removes its bottom half. You can revolve the resulting half-curve to create a paraboloid.
PYTHON COMMAND: parabola(label,x0,y0,z0,focal_length,axial_length,half_only)
PARABOLA PARAMETERS
| Parameter Name | Value Type | Units | Default Value | Notes |
|---|---|---|---|---|
| LCS_X | real numeric | project units | - | X-coordinates of base |
| LCS_Y | real numeric | project units | - | Y-coordinates of base |
| LCS_Z | real numeric | project units | - | Z-coordinates of base |
| rot_X | real numeric | degrees | - | local rotation about X-axis |
| rot_Y | real numeric | degrees | - | local rotation about Y-axis |
| rot_Z | real numeric | degrees | - | local rotation about Z-axis |
| focal_length | real numeric | project units | - | - |
| axial_length | real numeric | project units | - | - |
| aperture | real numeric | degrees | - | is determined automatically by focal and axial lengths or can be set independently |
| create_half | Boolean | - | FALSE | if TRUE, draws the left half only |
Point Tool
MENU: Object → Special → Point
TO DRAW A POINT:
- Activate the Point Tool.
- Left-click to establish the location of the point.
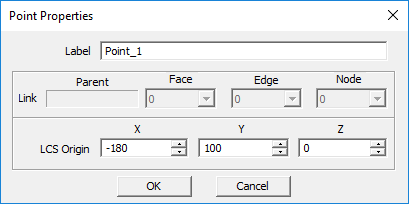
PYTHON COMMAND: point(label,x0,y0,z0)
POINT PARAMETERS
| Parameter Name | Value Type | Units | Default Value | Notes |
|---|---|---|---|---|
| LCS_X | real numeric | project units | - | X-coordinate of point |
| LCS_Y | real numeric | project units | - | Y-coordinate of point |
| LCS_Z | real numeric | project units | - | Z-coordinate of point |
Polyline Tool
MENU: Object → Curve → Polyline
TO DRAW A POLYLINE:
- Activate the Polyline Tool.
- Click anywhere on the active work plane to create nodes. The polyline's contour is rendered as soon as the second node is defined. A polyline must have at least two nodes.
- Create as many nodes as you want. You can finish the drawing either by double-clicking on the last node or first creating the last node and pressing the keyboard's Enter key.
- The polyline can be closed at any time using the keyboard shortcut C. This connects the last drawn node to the first.
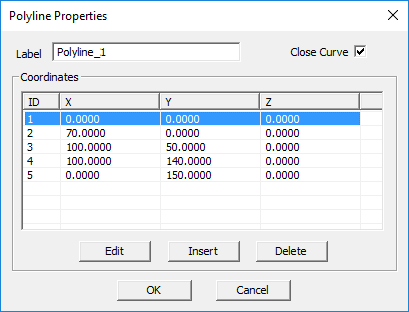
NOTES, SPECIAL CASES OR EXCEPTIONS: If a polyline object is originally drawn as an open curve, you can turn it into a closed one by placing a check mark in the box labeled Close Curve. The property dialog of a polyline object lists the individual nodes and their coordinates ordered by the node ID. You can select and highlight each node and change its coordinates using the Edit button of the dialog. You can also delete each node using the Delete key or insert a new node between the selected node and its next node using the Insert key. The new node is placed at the midpoint between the selected node and the node having the next ID number.
PYTHON COMMAND: polyline(label,(x0,y0,z0),(x1,y1,z1) ... )
Polystrip Tool
MENU: Object → Surface → Polystrip
TO DRAW A POLYSTRIP:
- Activate the Polystrip Tool.
- Click anywhere on the active work plane to create nodes. The polystrip's contour is rendered as soon as the third node is defined. A Polystrip must have at least three nodes.
- Create as many nodes as you want. You can finish the drawing either by double-clicking on the last node or first creating the last node and pressing the keyboard's Enter key.
NOTES, SPECIAL CASES OR EXCEPTIONS: The property dialog of a polystrip object lists the individual nodes and their coordinates ordered by the node ID. You can select and highlight each node and change its coordinates using the Edit button of the dialog. You can also delete each node using the Delete key or insert a new node between the selected node and its next node using the Insert key. The new node is placed at the midpoint between the selected node and the node having the next ID number.
PYTHON COMMAND: polystrip(label,(x0,y0,z0),(x1,y1,z1) ... )
Pyramid Tool
MENU: Object → Solid → Pyramid
TO DRAW A PYRAMID:
- Activate the Pyramid Tool.
- Left-click to establish the first point of the rectangular base plane.
- Define the desired area of the base plane by dragging the mouse away from the first point. Left-click a second time to establish the base plane.
- Drag the mouse away from the base plane to establish the desired height. Left-click a third time to complete the pyramid.
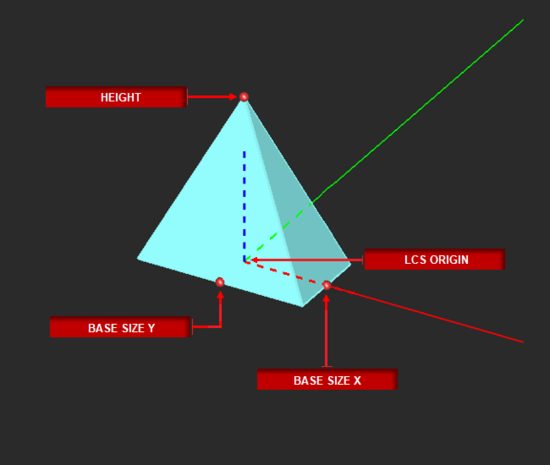
PYTHON COMMAND: pyramid(label,x0,y0,z0,base_x,base_y,height[,top_x,top_y,cap_top,cap_bottom])
PYRAMID PARAMETERS
| Parameter Name | Value Type | Units | Default Value | Notes |
|---|---|---|---|---|
| LCS_X | real numeric | project units | - | X-coordinates of base |
| LCS_Y | real numeric | project units | - | Y-coordinates of base |
| LCS_Z | real numeric | project units | - | Z-coordinates of base |
| rot_X | real numeric | degrees | - | local rotation about X-axis |
| rot_Y | real numeric | degrees | - | local rotation about Y-axis |
| rot_Z | real numeric | degrees | - | local rotation about Z-axis |
| base_size_X | real numeric | project units | - | - |
| base_size_Y | real numeric | project units | - | - |
| top_size_X | real numeric | project units | 0 | - |
| top_size_Y | real numeric | project units | 0 | - |
| height | real numeric | project units | - | - |
| top_offset_X | real numeric | project units | 0 | - |
| top_offset_Y | real numeric | project units | 0 | - |
| fix_center_X | Boolean | - | TRUE | fixes X-coordinate of base |
| fix_center_Y | Boolean | - | TRUE | fixes Y-coordinate of base |
| cap_top | Boolean | - | TRUE | places a cap at top |
| cap_bottom | Boolean | - | TRUE | places a cap at bottom base |
Radial Strip Tool
MENU: Object → Surface → Radial Strip
TO DRAW A RADIAL STRIP:
- Activate the Radial Strip Tool.
- Left-click to establish the origin point.
- Drag the mouse away from origin and left-click a second time to establish the radius and the first leg of the radial strip.
- Drag the mouse to the desired location to define the angle of the radial strip. Left-click a third time to complete the radial strip.
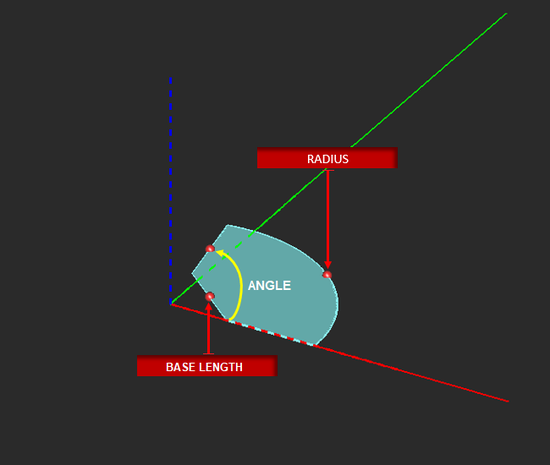
PYTHON COMMAND: radial_strip(label,x0,y0,z0,radius,base_lenght,angle)
RADIAL STRIP PARAMETERS
| Parameter Name | Value Type | Units | Default Value | Notes |
|---|---|---|---|---|
| LCS_X | real numeric | project units | - | X-coordinates of base |
| LCS_Y | real numeric | project units | - | Y-coordinates of base |
| LCS_Z | real numeric | project units | - | Z-coordinates of base |
| rot_X | real numeric | degrees | - | local rotation about X-axis |
| rot_Y | real numeric | degrees | - | local rotation about Y-axis |
| rot_Z | real numeric | degrees | - | local rotation about Z-axis |
| radius | real numeric | project units | - | - |
| base_length | real numeric | project units | 0 | A nonzero value creates a flattened base |
| angle | real numeric | degrees | - | wedge angle |
Rectangle Strip Tool
MENU: Object → Surface → Rectangle Strip
TO DRAW A RECTANGLE STRIP:
- Activate the Rectangle Strip Tool.
- Left-click to establish the X/Y axial triangulation point.
- Drag the mouse outward from this point to define the desired area of the rectangle strip. Left-click a second time to complete the shape.
PYTHON COMMAND: rect_strip(label,x0,y0,z0,side_x,side_y)
RECTANGLE STRIP PARAMETERS
| Parameter Name | Value Type | Units | Default Value | Notes |
|---|---|---|---|---|
| LCS_X | real numeric | project units | - | X-coordinates of base |
| LCS_Y | real numeric | project units | - | Y-coordinates of base |
| LCS_Z | real numeric | project units | - | Z-coordinates of base |
| rot_X | real numeric | degrees | - | local rotation about X-axis |
| rot_Y | real numeric | degrees | - | local rotation about Y-axis |
| rot_Z | real numeric | degrees | - | local rotation about Z-axis |
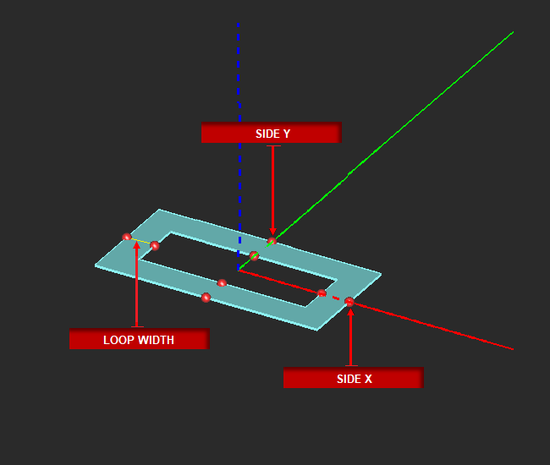
| side_X | real numeric | project units | - | dimension along X-axis |
| side_Y | real numeric | project units | - | dimension along Y-axis |
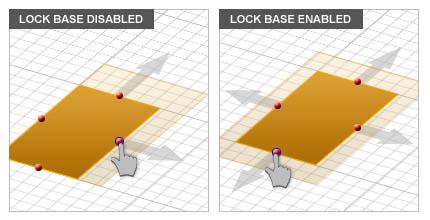
| fix_center_X | Boolean | - | TRUE | fixes X-coordinate of base |
| fix_center_Y | Boolean | - | TRUE | fixes Y-coordinate of base |
| rect_loop | Boolean | - | FALSE | if TRUE, creates a rectangular loop |
| loop_width | real numeric | project units | - | - |
Regular Polygon Tool
MENU: Object → Surface → Regular Polygon
TO DRAW A REGULAR POLYGON:
- Activate the Regular Polygon Tool.
- Left-click to create the origin of the Regular Polygon.
- Drag away from the origin and left-click a second time to define the Regular Polygon's diameter.
- Drag the mouse to increase or decrease the number of sides desired. Left-click a third time to finish drawing the Regular Polygon.
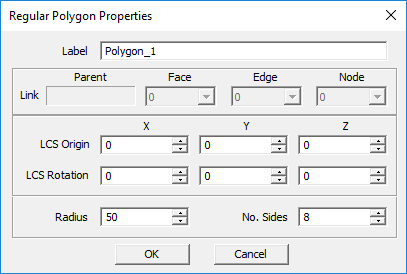
NOTES, SPECIAL CASES OR EXCEPTIONS: This tool creates a regular polygon with an arbitrary number of sides within a circumscribing circle of a specified radius.
PYTHON COMMAND: polygon_reg(label,x0,y0,z0,radius,n_sides)
REGULAR POLYGON PARAMETERS
| Parameter Name | Value Type | Units | Default Value | Notes |
|---|---|---|---|---|
| LCS_X | real numeric | project units | - | X-coordinates of base |
| LCS_Y | real numeric | project units | - | Y-coordinates of base |
| LCS_Z | real numeric | project units | - | Z-coordinates of base |
| rot_X | real numeric | degrees | - | local rotation about X-axis |
| rot_Y | real numeric | degrees | - | local rotation about Y-axis |
| rot_Z | real numeric | degrees | - | local rotation about Z-axis |
| radius | real numeric | project units | - | radius of circumscribing circle |
| side_count | integer numeric | - | - | number of side of regular polygon |
| top_width | real numeric | project units | - | - |
Solid Generator
MENU: Object → Solid → Solid Generator
TO DRAW A PLATONIC SOLID:
- Activate the Solid Generator Tool.
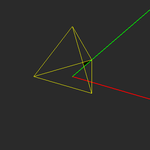
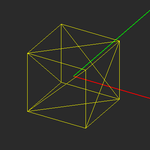
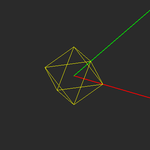
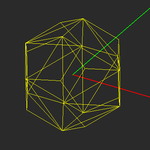
- In the solid generator dialog, select one of the five platonic solid types Tetrahedron, Hexahedron Octahedron, Dodecahedron, or Icosahedron.
- The dialog shows the number of faces, edges, nodes and the side length of the standard platonic solid of the selected type.
- Specify the value of the Scale parameter based on the displayed Side Length.
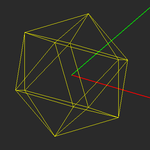
- Before you create the solid and add its name to the navigation tree, you have an opportunity to preview it. To do so, click the Preview button of the dialog. A yellow ghost of the solid appears in the project workspace. You can change the scale and resize the solid. Once you are satisfied with the generated solid, click the Create button to finalize its creation.
NOTES, SPECIAL CASES OR EXCEPTIONS: All the solid objects generated by the solid generator are of polymesh type.
PYTHON COMMAND: None
PLATONIC SOLID PROPERTIES
| Solid Type | No. of Faces | No. of Edges | No. of Vertices | Side Length | Geometry |
|---|---|---|---|---|---|
| Tetrahedron | 4 | 6 | 4 | 2 | |
| Tessellated Hexahedron | 12 | 12 | 8 | 2 | |
| Octahedron | 8 | 12 | 6 | √2 | |
| Tessellated Dodecahedron | 36 | 30 | 20 | √5 - 1 | |
| Icosahedron | 20 | 30 | 12 | 2 |
Sphere Tool
MENU: Object → Solid → Sphere
TO DRAW A SPHERE:
- Activate the Sphere Tool.
- Left-click to establish the origin point. Drag the mouse outward from the origin to establish the radius.
- Left-click a second time to complete the sphere.
PYTHON COMMAND: sphere(label,x0,y0,z0,radius[,start_angle,end_angle])
SPHERE PARAMETERS
| Parameter Name | Value Type | Units | Default Value | Notes |
|---|---|---|---|---|
| LCS_X | real numeric | project units | - | X-coordinates of base |
| LCS_Y | real numeric | project units | - | Y-coordinates of base |
| LCS_Z | real numeric | project units | - | Z-coordinates of base |
| rot_X | real numeric | degrees | - | local rotation about X-axis |
| rot_Y | real numeric | degrees | - | local rotation about Y-axis |
| rot_Z | real numeric | degrees | - | local rotation about Z-axis |
| radius | real numeric | project units | - | - |
| start_angle | real numeric | degrees | 0 | start azimuth angle |
| end_angle | real numeric | degrees | 360 | end azimuth angle |
Spiral Curve Tool
MENU: Object → Curve → Spiral
TO DRAW A SPIRAL CURVE:
- Activate the Spiral Curve Tool.
- Left-click to establish the inner-radial origin of the Spiral.
- Drag away from the origin to expands the inner radius (drag inward toward the origin to reduces the inner radius).
- Left-click a second time to set the inner radius and create the anchor point for the outer radius.
- Drag the mouse away from the second point to expand the outer radius or closer to reduce the radius.
- Left-click a third time to complete the spiral.
PYTHON COMMAND: spiral_curve(label,x0,y0,z0,radius_inner,radius_outer,nturns,spiral_dir,is_dual)
SPIRAL CURVE PARAMETERS
| Parameter Name | Value Type | Units | Default Value | Notes |
|---|---|---|---|---|
| LCS_X | real numeric | project units | - | X-coordinates of base |
| LCS_Y | real numeric | project units | - | Y-coordinates of base |
| LCS_Z | real numeric | project units | - | Z-coordinates of base |
| rot_X | real numeric | degrees | - | local rotation about X-axis |
| rot_Y | real numeric | degrees | - | local rotation about Y-axis |
| rot_Z | real numeric | degrees | - | local rotation about Z-axis |
| inner_radius | real numeric | project units | - | - |
| outer_radius | real numeric | project units | - | - |
| turns | integer numeric | project units | 2 | number of spiral turns |
| ccw | Boolean | - | TRUE | if TRUE, creates counterclockwise right-handedness |
| dual_arm | Boolean | - | FALSE | creates a dual-arm spiral |
Spiral Strip Tool
MENU: Object → Surface → Spiral Strip
TO DRAW A SPIRAL STRIP:
- Activate the Spiral Strip Tool.
- Left-click to establish the origin of the Spiral Strip's inner-radius.
- Drag away from the origin to expand the inner radius. Left-click a second time to set the inner radius and create the starting point for the outer radius.
- Drag the mouse away from the second point to expand the outer radius (or closer to contract the radius). Left-click a third time to complete the spiral.
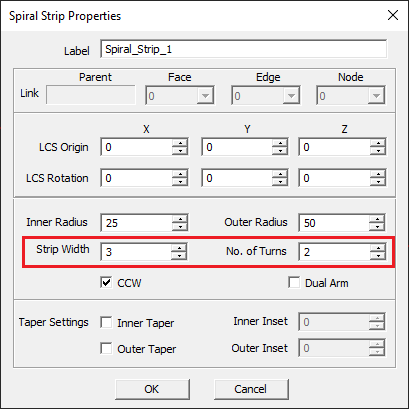
NOTES, SPECIAL CASES OR EXCEPTIONS: Checking the Inner Taper box creates a rounded taper at the inner edge of each spiral arm by drawing an exponential curve from a user-defined edge inset point to that edge's opposite corner vertex. Checking the Outer Taper box creates a rounded taper at the outer edge of each spiral arm by drawing an exponential curve from a user-defined edge inset point to that edge's opposite corner vertex.. Inset Distance establishes an imaginary offset point positioned away from the corner vertex from the inner or outer edge. The Inner Radius setting is not available when the Dual Arm option is enabled.
PYTHON COMMAND: spiral_strip(label,x0,y0,z0,width,radius_inner,radius_outer,n_turns,spiral_dir,is_dual)
SPIRAL STRIP PARAMETERS
| Parameter Name | Value Type | Units | Default Value | Notes |
|---|---|---|---|---|
| LCS_X | real numeric | project units | - | X-coordinates of base |
| LCS_Y | real numeric | project units | - | Y-coordinates of base |
| LCS_Z | real numeric | project units | - | Z-coordinates of base |
| rot_X | real numeric | degrees | - | local rotation about X-axis |
| rot_Y | real numeric | degrees | - | local rotation about Y-axis |
| rot_Z | real numeric | degrees | - | local rotation about Z-axis |
| inner_radius | real numeric | project units | - | - |
| outer_radius | real numeric | project units | - | - |
| strip_width | real numeric | project units | - | - |
| turns | integer numeric | project units | 2 | number of spiral turns |
| ccw | Boolean | - | TRUE | if TRUE, creates counterclockwise right-handedness |
| dual_arm | Boolean | - | FALSE | creates a dual-arm spiral |
| inner_taper | Boolean | - | FALSE | if TRUE, tapers spiral strip from inner end |
| inner_inset | real numeric | project units | 0 | when inner_taper is TRUE, a nonzero value creates inner inset |
| outer_taper | Boolean | - | FALSE | if TRUE, tapers spiral strip from outer end |
| outer_inset | real numeric | project units | 0 | when outer_taper is TRUE, a nonzero value creates outer inset |
| taper_pointing | list: {inward, outward} | - | inward | sets the direction spiral's end tapers point to |
Super-Quadratic Curve Tool
MENU: Object → Curve → Super-quadratic Curve
TO DRAW A SUPER-QUADRATIC CURVE:
- Activate the Super-Quadratic Curve Tool.
- Left-click to establish the initial X/Y diameter triangulation point.
- Drag the mouse away from this point to define the desired size.
- Left-click a second time to complete the superquad.
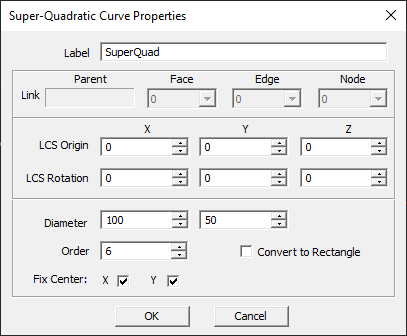
NOTES, SPECIAL CASES OR EXCEPTIONS: The parameter Order changes the radius of the four corners of the super-quadratic curve. The second-order super-quadratic curve (n = 2) corresponds to an ellipse. Entering a higher value for the order decreases the corner radius and make the curve look like a rectangle with rounded corners. Checking the Rectangle box creates a rectangular curve with no corner rounding.
PYTHON COMMAND: superquad(label,x0,y0,z0,diam_x,diam_y,order)
SUPER-QUADRATIC CURVE PARAMETERS
| Parameter Name | Value Type | Units | Default Value | Notes |
|---|---|---|---|---|
| LCS_X | real numeric | project units | - | X-coordinates of base |
| LCS_Y | real numeric | project units | - | Y-coordinates of base |
| LCS_Z | real numeric | project units | - | Z-coordinates of base |
| rot_X | real numeric | degrees | - | local rotation about X-axis |
| rot_Y | real numeric | degrees | - | local rotation about Y-axis |
| rot_Z | real numeric | degrees | - | local rotation about Z-axis |
| diameter_X | real numeric | project units | - | diameter along X-axis |
| diameter_Y | real numeric | project units | - | diameter along Y-axis |
| order | integer numeric | degrees | 2 | a higher order resembles a rectangle with rounded corners |
| is_rectangle | Boolean | - | FALSE | if TRUE, draws a rectangle |
| fix_center_X | Boolean | - | TRUE | fixes X-coordinate of base |
| fix_center_Y | Boolean | - | TRUE | fixes Y-coordinate of base |
Surface Generator
MENU: Object → Surface → Surface Generator
TO DRAW A PARAMETRIC SURFACE:
- Activate the Surface Generator Tool.
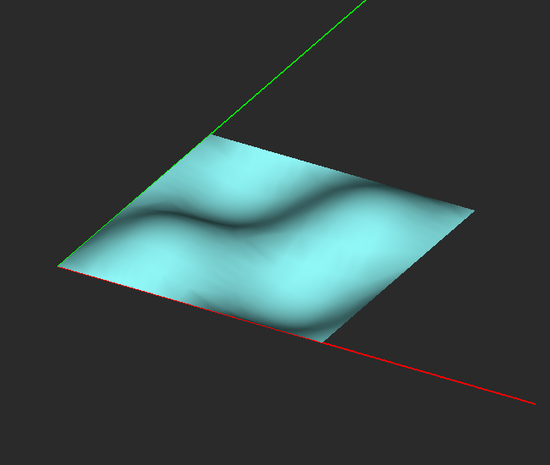
- Left-click to establish the location of the new parametric surface. A default 2D sinusoidal surface appears in the project workspace.
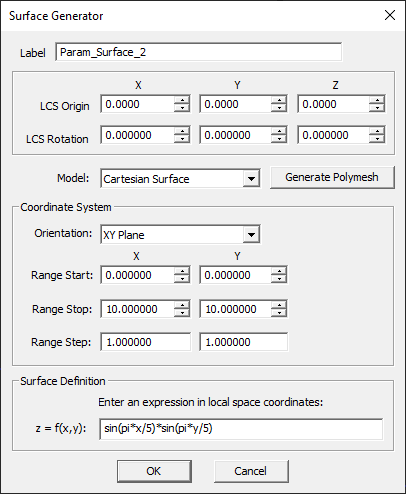
- The surface generator dialog opens up on the lower left corner of the screen. You have three options for Orientation: XY, YZ or ZX planes. With the XY plane orientation, the parametric surface is expressed as z = f(x,y). With the YZ plane orientation, the parametric surface is expressed as x = f(y,z). With the ZX plane orientation, the parametric surface is expressed as y = f(z,x).
- Enter start, stop and step values for the ranges of both coordinate variables in the selected orientation plane.
- Enter a mathematical expression in terms of the coordinate variables in the selected orientation plane for the definition of the parametric surface.
- Make sure to click the OK button of the dialog to complete the surface construction.
NOTES, SPECIAL CASES OR EXCEPTIONS: You can always edit and modify a parametric surface after you first create it in the surface generator. The property dialog of a parametric surface object is indeed the surface generator itself, where you can change the parameter values or the defining expression.
PYTHON COMMAND: param_surface(label,x0,y0,z0,orientation,start_1,stop_1,step_1,start_2,stop_2,step_2,function)
PARAMETRIC SURFACE PARAMETERS
| Parameter Name | Value Type | Units | Default Value | Notes |
|---|---|---|---|---|
| LCS_X | real numeric | project units | - | X-coordinates of the surface |
| LCS_Y | real numeric | project units | - | Y-coordinates of the surface |
| LCS_Z | real numeric | project units | - | Z-coordinates of the surface |
| rot_X | real numeric | degrees | 0 | local rotation about X-axis |
| rot_Y | real numeric | degrees | 0 | local rotation about Y-axis |
| rot_Z | real numeric | degrees | 0 | local rotation about Z-axis |
| orientation | three options: XY, YZ or ZX | - | XY | the coordinate plane in which the parametric surface is drawn |
| start_1 | real numeric | project units | 0 | start value of range of the first coordinate variable |
| stop_1 | real numeric | project units | 10 | stop value of range of the first coordinate variable |
| step_1 | integer numeric | project units | 1 | step value of range of the first coordinate variable |
| start_2 | real numeric | project units | 0 | start value of range of the second coordinate variable |
| stop_2 | real numeric | project units | 10 | stop value of range of the second coordinate variable |
| step_2 | integer numeric | project units | 1 | step value of range of the second coordinate variable |
| expression | text string | - | sin(pi*x/5)*sin(pi*y/5) | mathematical expression in two local coordinate variables |
Taper Strip Tool
MENU: Object → Surface → Taper Strip
TO DRAW A TAPER STRIP:
- Activate the Taper Strip Tool.
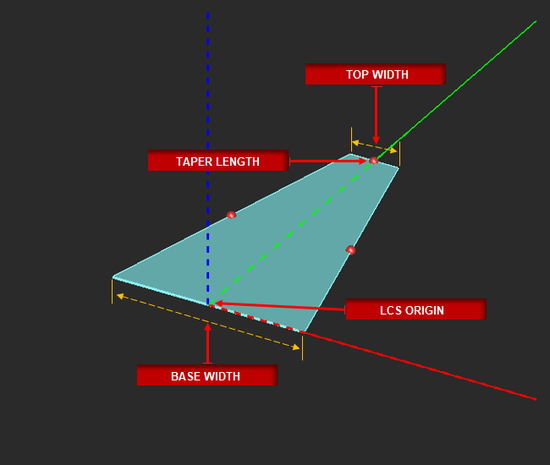
- Left-click to establish the base length midpoint.
- Drag outward from this point to define the desired length and angle of the base side. Left-click a second time to define the base.
- To establish the height, drag the mouse away from the base to the desired location. Left-click a third time to complete the Taper Strip.
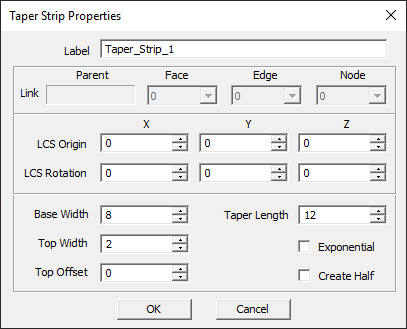
NOTES, SPECIAL CASES OR EXCEPTIONS: Taper Length establishes the distance between the base and top sides of the trapezoid. If the Exponential check box is checked, the two slanted sides of the trapezoid are replaced by exponential curves passing through the same vertices.
PYTHON COMMAND: taper_strip(label,x0,y0,z0,base_width,top_width,length,is_expo)
TAPER STRIP PARAMETERS
| Parameter Name | Value Type | Units | Default Value | Notes |
|---|---|---|---|---|
| LCS_X | real numeric | project units | - | X-coordinates of base |
| LCS_Y | real numeric | project units | - | Y-coordinates of base |
| LCS_Z | real numeric | project units | - | Z-coordinates of base |
| rot_X | real numeric | degrees | - | local rotation about X-axis |
| rot_Y | real numeric | degrees | - | local rotation about Y-axis |
| rot_Z | real numeric | degrees | - | local rotation about Z-axis |
| base_width | real numeric | project units | - | - |
| taper_length | real numeric | project units | - | - |
| top_width | real numeric | project units | - | - |
| top_offset | real numeric | project units | 0 | A zero value creates an isosceles triangle |
| exponential | Boolean | - | FALSE | creates an exponential taper transition |
| create-half | Boolean | - | FALSE | keeps left half of taper strip only |
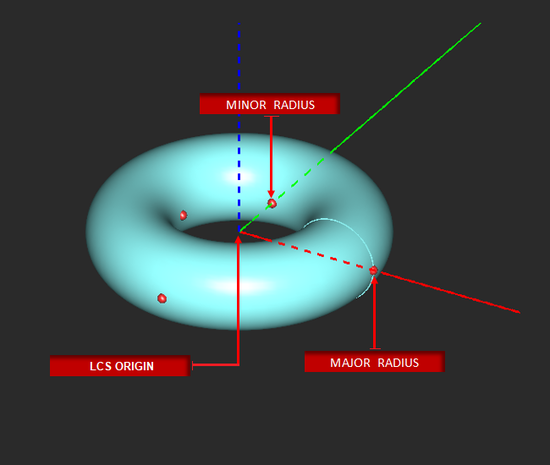
Torus Tool
MENU: Object → Solid → Torus
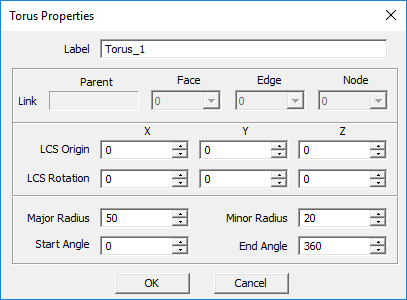
TO DRAW A TORUS:
- Activate the Torus Tool.
- Left-click to define the center point.
- Drag the mouse away from the origin and left-click a second time to establish the Major Radius of the torus.
- Drag the mouse away from the Major Radius construction path to establish the Minor Radius. Left-click a third time to complete the torus.
PYTHON COMMAND: torus(label,x0,y0,z0,radius_major,radius_minor[,start_angle,end_angle])
TORUS PARAMETERS
| Parameter Name | Value Type | Units | Default Value | Notes |
|---|---|---|---|---|
| LCS_X | real numeric | project units | - | X-coordinates of base |
| LCS_Y | real numeric | project units | - | Y-coordinates of base |
| LCS_Z | real numeric | project units | - | Z-coordinates of base |
| rot_X | real numeric | degrees | - | local rotation about X-axis |
| rot_Y | real numeric | degrees | - | local rotation about Y-axis |
| rot_Z | real numeric | degrees | - | local rotation about Z-axis |
| major_radius | real numeric | project units | - | - |
| minor_radius | real numeric | project units | - | - |
| start_angle | real numeric | degrees | 0 | start azimuth angle |
| end_angle | real numeric | degrees | 360 | end azimuth angle |
Triangle Strip Tool
MENU: Object → Surface → Triangle Strip
TO DRAW A TRIANGLE STRIP:
- Activate the Triangle Strip Tool.
- Left-click to establish the triangles origin.
- Drag away from the origin and left-click a second time to define Leg 1 of the triangle.
- Drag away from leg 1, left-click a third time to define Leg 2 and complete the triangle.
NOTES, SPECIAL CASES OR EXCEPTIONS: Side 1 establish the length of first leg of the triangle. Side 2 establishes the length of the second leg of the triangle Angle defines the opening angle of the origin vertex (the angle between leg one and leg two). Hold down the Shift key while positioning the third point of the triangle to constrain the origin angle to 15º increments.
PYTHON COMMAND: triangle_strip(label,x0,y0,z0,side1,side2,angle)
TRIANGLE STRIP PARAMETERS
| Parameter Name | Value Type | Units | Default Value | Notes |
|---|---|---|---|---|
| LCS_X | real numeric | project units | - | X-coordinates of base |
| LCS_Y | real numeric | project units | - | Y-coordinates of base |
| LCS_Z | real numeric | project units | - | Z-coordinates of base |
| rot_X | real numeric | degrees | - | local rotation about X-axis |
| rot_Y | real numeric | degrees | - | local rotation about Y-axis |
| rot_Z | real numeric | degrees | - | local rotation about Z-axis |
| side_1 | real numeric | project units | - | - |
| side_2 | real numeric | project units | 0 | - |
| angle | real numeric | degrees | - | wedge angle |


