EM.Tempo Tutorial Lesson 8: Analyzing A Periodic Frequency Selective Surface
Contents
What You Will Learn
In this tutorial you will learn how to define periodic structures in EM.Tempo, excite them using plane wave sources and compute the reflection and transmission characteristics of the periodic surface. You will become familiar with the subtleties of modeling oblique incident angles.
![]() Back to EM.Tempo Tutorial Gateway
Back to EM.Tempo Tutorial Gateway
![]() Download projects related to this tutorial lesson
Download projects related to this tutorial lesson
Getting Started
Open the EM.Cube application and switch to EM.Tempo. Start a new project with the following attributes:
EM.Tempo uses the constant transverse wavenumber method also known as the direct spectral domain FDTD method to solve periodic structures. In this formulation, all the six electric and magnetic field components have complex temporal variations at all points in the space. This is different than the regular aperiodic FDTD which assumes pure real field values. Due to this fact, the FDTD simulation of a periodic unit cells is typically slower than that of its regular aperiodic counterpart. When the plane wave source has a normal incidence, EM.Tempo performs a Fourier transform of the computed time-domain reflection and transmission coefficients and thus outputs the wideband frequency-domain reflection and transmission coefficients at the end of a single-run "wideband analysis". When the plane wave source has an oblique incidence (0 < θ < 180°), the current version of EM.Tempo only calculates the frequency-domain reflection and transmission coefficients at the center frequency of your project.
Building the Periodic Unit Cell Structure
Draw a thick dielectric substrate and a metal strip according to the table below. Use EM.Cube's materials list to select ROGER RT/Duroid 5880 with εr = 2.2 as the material of the dielectric substrate.
| Part | Object Type | Material Type | Dimensions | Coordinates | Rotation Angles |
|---|---|---|---|---|---|
| Box_1 | Box | ROGER RT/Duroid 5880 | 15mm × 15mm × 6mm | (0, 0, 0) | (0°, 0°, 0°) |
| Rect_Strip_1 | Rectangle Strip | PEC | 3mm × 12mm | (0, 0, 6mm) | (0°, 0°, 0°) |
Next, right-click on the Periodicity item in the "Computational Domain" section of the navigation tree and select Periodicity Settings from the contextual menu. In the Periodicity Settings dialog, check the box labeled Periodic Structure and accept the default periods: X Spacing and Y Spacing both equal to 15mm.
Define a downward-looking, normally incident plane wave source with TEz Polarization. Keep the default incident angles of θ = 180° and φ = 0°.
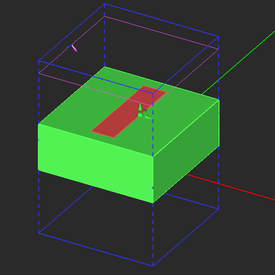
Note that unlike regular aperiodic structures, in which the plane wave box encloses the entire physical structure, here you see a purple plane placed at a certain height above the periodic structure. For periodic structures in FDTD, the plane wave source is enforced at a plane placed at a certain Z-coordinate. The default periodic source plane is placed 0.15λ0 above (or blow) the largest bounding box of the physical structure. You can change its location from the Plane Wave Dialog. For this tutorial lesson, you will keep the Default options of the excitation box.
The periodic unit cell of your frequency selective surface (FSS) made up of a rectangular metal strip on a thick dielectric substrate should look like this:
Running a Periodic FDTD Analysis of the Periodic Structure
Before running a simulation, do the following:
- Keep the default domain settings.
- Keep the default mesh settings.
- Change the Termination Criterion to a Fixed No. Time Steps equal to 2,500.
Now run a wideband Analysis of your periodic structure. Plot the graphs of the reflection and transmission coefficients of your periodic structure. This can be done conveniently by right clicking on the Periodic Characteristics item in the Observables section of the Navigation Tree and selecting either Plot Reflection Coefficient… or Plot Transmission Coefficient… from the contextual menu. You can also plot these graphs from the Data Manager through the output data files “reflection_coefficient.CPX” and “transmission_coefficient.CPX”. The plots show the variation of the reflection and transmission (R/T) coefficients with frequency over the specified bandwidth of your project. As you can see from the figures below, the FSS has a narrow transmission window slightly above 9GHz.
Examining a Case of Oblique Plane Wave Incidence
In the case of oblique plane wave incidence on a periodic structure, EM.Tempo calculates the reflection and transmission coefficients only at the center frequency fc. As a result, you can reduce the bandwidth considerably. This helps the convergence of the FDTD marching loop in such cases. Open the frequency dialog either by double-clicking the small frequency box in the status bar or simply using the keyboard shortcut Ctrl+F. In the frequency dialog, set the bandwidth to 2GHz. Define an incident plane wave source with TEz Polarization and incident angles θ = 135° and φ = 0°.
At a center frequency of 9GHz and a incident plane wave angle of θ = 135°, the transverse wavenumber is calculated to be:
[math] k_l = k_0 \sin\theta = \frac{2\pi f}{c} \sin\theta = \frac{(2\pi)(9\times 10^9)}{3\times 10^8} \sin(135^\circ) = 133.286 m^{-1} [/math]
The value of the transverse wavenumber kl is kept constant during the FDTD simulation. This limits the frequency bandwidth of FDTD’s temporal waveform (i.e., the modulated Gaussian pulse) due to the appearance of a horizontal resonant frequency at:
[math] f_{res} = f_0 \sin\theta = (9GHz)\sin(135^\circ) = 6.364GHz [/math]
This resonant frequency indeed corresponds to an incident angle of θ = 90° (a laterally propagating wave) for the same constant value of kl = 133.286 m-1. EM.Tempo automatically adjusts the temporal waveform of the FDTD simulation engine by pushing the modulation frequency away from fres to avoid horizontal resonances. In fact, the FDTD simulation results are correct at the center frequency of project with the specified incident θ angle, as well as at all the (fi, θi) pairs that satisfy the following equation:
[math] \frac{2\pi f_i}{c} \sin\theta_i = k_l = const. [/math]
To make sure that a resonance doesn't happen, let's initiate a temporal field probe to monitor the fields as a function of time. A field probe is used to record all the six field components Ex, Ey, Ez, Hz, Hy, Hz, at a single point in the computational domain during the entire FDTD time marching loop. Right-click on the Temporal Field Probes item of the navigation tree and select Insert new Observable... from the contextual menu. In the field probe dialog, enter coordinated (1.5mm, 0, 6mm) for "Probe_1". Uncheck the "Compute Fields at the Center of Yee Cell" checkbox.
Run a new FDTD analysis with a fixed maximum No. of Time Steps equal to 2,500 and wait until it is completed. Open the data manager and plot the data file "Probe_1_X_H_Time.CPX". Note that due to the special nature of EM.Tempo's periodic FDTD formulation, the time-domain fields are complex-valued. By contrast, the time-domain fields of regular aperiodic structures are real-valued. The figure below shows the X-component of the magnetic field at the right edge of the metallic strip as a function of time. This is proportional to the surface current flowing at the edge of the strip. You can see from the figure that the waveform dies off over time, so it converges and doesn't oscillate.
If you view the contents of the data files “reflection_coefficient.CPX” and “transmission_coefficient.CPX” in Data Manager, you will find that both files contain only one frequency data point, which is the center frequency of the project:
R: -0.883362 + 0.216773j
T: 0.106207 - 0.402591j
Running a Parametric Frequency Sweep
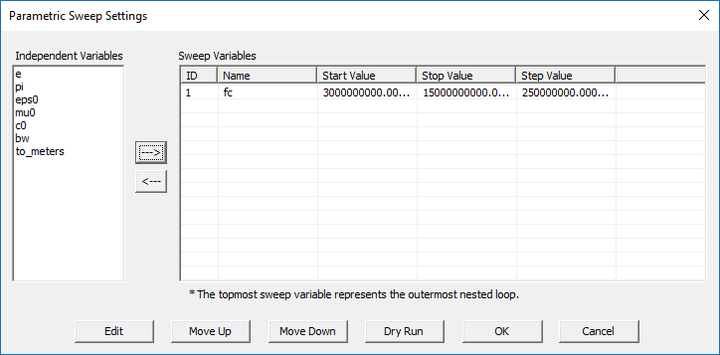
In order to examine the frequency variations of the reflection and transmission coefficients in the case of oblique plane wave incidence, you need to run a parametric sweep in EM.Tempo with the center frequency fc being your sweep variable. You already ran a parametric sweep of a patch antenna in Tutorial Lesson 3. Open the Run dialog and select Parametric Sweep from the Simulation Mode drop-down list. Click the Settings button next to this drop-down list to open up the sweep settings dialog. Select "fc" as your sweep variable with the start, stop and step values equal to 3e+9 (3GHz), 15e+9 (15GHz) and 2.5e+8 (250MHz). Keep in mind that the project variables "fc" and "bw" are always expressed in Hz.
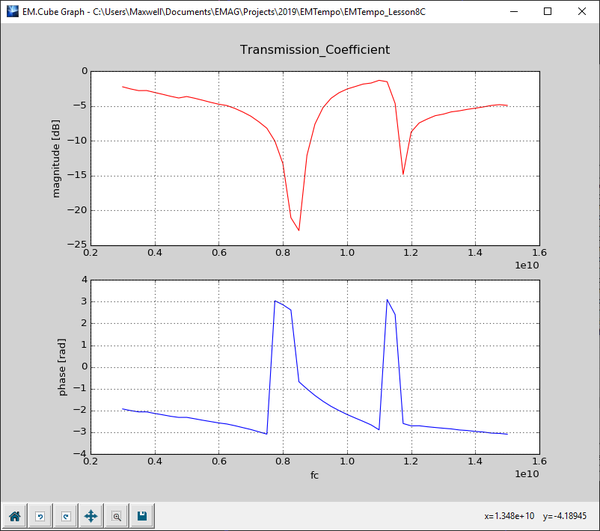
Start the sweep simulation and wait until all the frequency samples are computed. Then, plot the Cartesian graphs of the R/T coefficients.
| |
In the case of oblique plane wave incidence, EM.Tempo computes the reflection and transmission coefficients of a periodic structure only at the center frequency of the project. In that case, you need to run a parametric frequency sweep of your FSS structure. It is recommended that you reduce the bandwidth of the excitation waveform for a frequency sweep. |


