Difference between revisions of "EM.Ferma Tutorial Lesson 1: Calculating the Electric Field and Potential Due to Charges"
Kazem Sabet (Talk | contribs) (→Creating a Charge Source Group and a Sphere Object) |
Kazem Sabet (Talk | contribs) (→Running the Electrostatic Simulation) |
||
| Line 130: | Line 130: | ||
==Running the Electrostatic Simulation== | ==Running the Electrostatic Simulation== | ||
| + | [[Image:STATTUT1_8.png|thumb|center|380px|The Static Module's Run dialog.]] | ||
At this time, your project is ready for electrostatic simulation. Click the <b>Run</b> [[Image:fdtd_runb.png]] Button of the Simulate Toolbar to open up the Simulation Run Dialog. Or alternatively, use the keyboard shortcut <b>Ctrl+R</b>, or the menu <b>Simulate → Run…</b> The simplest simulation mode in [[EM.Cube]] is “Analysis”. In this mode, your physical structure is taken “As Is” and its mesh is passed to the electrostatic simulation engine, along with the necessary information regarding the sources and observables. | At this time, your project is ready for electrostatic simulation. Click the <b>Run</b> [[Image:fdtd_runb.png]] Button of the Simulate Toolbar to open up the Simulation Run Dialog. Or alternatively, use the keyboard shortcut <b>Ctrl+R</b>, or the menu <b>Simulate → Run…</b> The simplest simulation mode in [[EM.Cube]] is “Analysis”. In this mode, your physical structure is taken “As Is” and its mesh is passed to the electrostatic simulation engine, along with the necessary information regarding the sources and observables. | ||
| Line 135: | Line 136: | ||
To run the simulation, click the <b>Run</b> button of the Simulation Run Dialog. A separate window pops up displaying messages from the simulation engine. Once the simulation has been completed, you can close the message window and return to the project workspace. The Navigation Tree is now populated with simulation results, most notably under Field Sensors. | To run the simulation, click the <b>Run</b> button of the Simulation Run Dialog. A separate window pops up displaying messages from the simulation engine. Once the simulation has been completed, you can close the message window and return to the project workspace. The Navigation Tree is now populated with simulation results, most notably under Field Sensors. | ||
| − | |||
| − | |||
| − | |||
| − | |||
| − | |||
| − | |||
| − | |||
| − | |||
| − | |||
| − | |||
| − | |||
==Visualizing the Simulation Data== | ==Visualizing the Simulation Data== | ||
Revision as of 20:35, 10 September 2015
Contents
- 1 What You Will Learn
- 2 Getting Started
- 3 Creating a Charge Source Group and a Sphere Object
- 4 Grid Settings & Mesh Generation
- 5 Defining Project Observables
- 6 Running the Electrostatic Simulation
- 7 Visualizing the Simulation Data
- 8 Verifying Your Simulation Results
- 9 Analyzing Two Spheres of Opposite Charges
What You Will Learn
This tutorial will guide you through all the necessary steps required to set up and perform a basic electrostatic simulation and visualize and graph the simulation results. Specifically, you will draw spherical charge objects and analyze their electric field and potential.
| |
We strongly recommend that you read through the first few tutorials and study them carefully before setting up your own projects. |
Getting Started
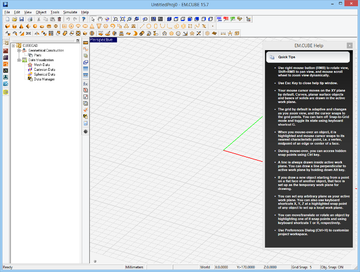
Open the EM.Cube application by double-clicking on its icon on your desktop. By default, EM.Cube opens a blank project with the name “UntitledProj1” in its CubeCAD Module. You can start drawing objects and build up your physical structure right away. Or you can initiate a new project by selecting the New ![]() button of the System Toolbar or using the keyboard shortcut Ctrl+N. This opens up the New Project Dialog, where you can enter a title for your new project and set its path on your hard drive. From the same dialog, you can also set the project’s Length Units, Frequency Units, Center Frequency and Bandwidth.
button of the System Toolbar or using the keyboard shortcut Ctrl+N. This opens up the New Project Dialog, where you can enter a title for your new project and set its path on your hard drive. From the same dialog, you can also set the project’s Length Units, Frequency Units, Center Frequency and Bandwidth.
For this tutorial lesson, set the following parameters in the new project dialog:
Click the Create button of the dialog to accept the settings. A new project folder with your given name is immediately created at your specified path.
To navigate to EM.Ferma (EM.Cube's Static Module), simply select its icon from the Module Toolbar on the left side of the screen. Any module may be selected this way. Selecting the module icon changes the contents of the navigation tree to reflect the types of objects supported by the current module.
| |
EM.Ferma is a static simulator that solves electromagnetic problems at DC or under low-frequency quasi-static approximation. Therefore, always leave the project's center frequency and bandwidth at their default value of 1GHz, as they are not used by the static simulations. |
Creating a Charge Source Group and a Sphere Object
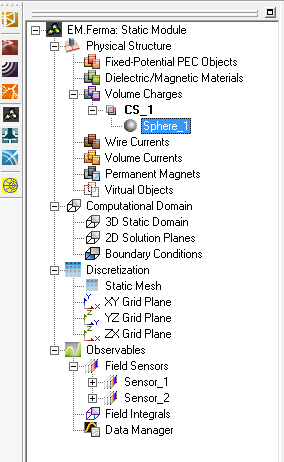
Before you draw a spherical charge object, first you have to create a charge object category on the navigation tree. In EM.Ferma, objects are grouped together and organized by their static behavior under the “Physical Structure” node of the navigation tree. There are several categories to choose from: Fixed-Potential PEC Objects, Dielectric/Magnetic Materials, Volume Charges, etc. four categories: PEC (metal), Dielectric, Charge (Source) and Current (Source). All the objects belonging to the same charge group have the same color as well as the same charge density.
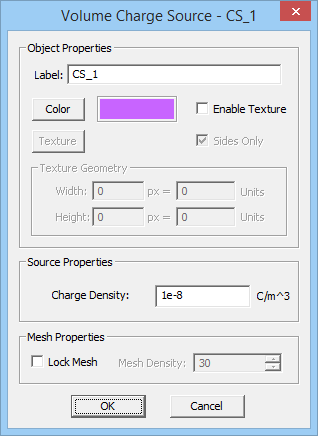
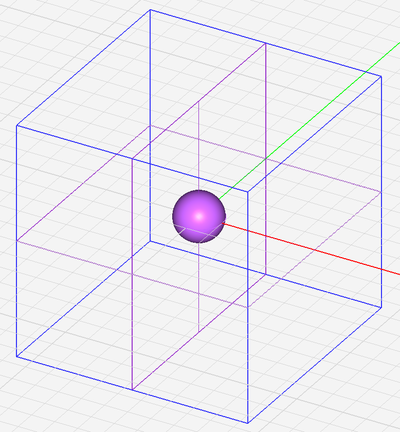
To create a new charge category, right-click on the Volume Charge item in the navigation tree and select Insert New Charge Source.... The New Charge Source dialog opens up with a default name CS_1 and a default purple color. In the section titled "Source Properties", you will see a default value of -1e-5C/m^3 for Charge Density. This means a default negative charge. The change this to a positive value of +1e-8 C/m3. Close the dialog and return to the project workspace (main window). The last object category created in the navigation tree remains as the "Active" group and highlighted in bold letters, meaning that all the objects you create and draw will belong to this group.
Select the Sphere Tool from the Object Toolbar (or use the keyboard shortcut F6, or the menu item Object > Solid > Sphere).
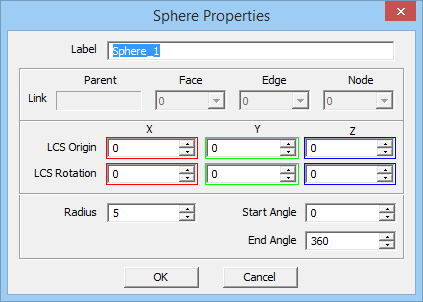
With the sphere tool selected, click the origin (0,0,0), and drag the mouse to start drawing a sphere. As you drag the mouse farther away from the center, the radius of the sphere grows. You can see the value of the radius in the object's property dialog, which pops up at the lower right corner of the screen. When the radius reaches a value of 5 units, left-click to lock-in the value. You may also left-click at any point and adjust the length by typing in a value of 5 in the object’s property dialog.
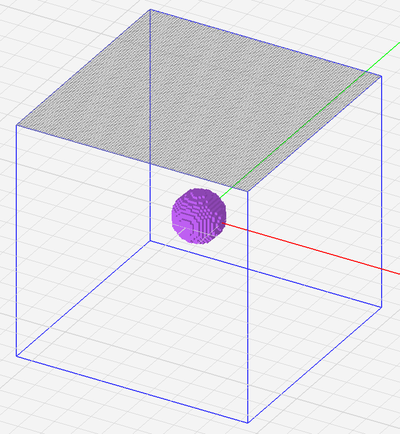
Once you draw your sphere object, its name, Sphere_1, is added to the navigation tree under CS_1 group, where it belongs. Note that a default blue box is automatically placed around the object. This is the domain box. You will explore the computational domain and boundary conditions in the next tutorial lesson. For this lesson, you will leave the default domain box intact.
Once your drawing is complete, you can zoom to fit your structure into the screen using the keyboard shortcut Ctrl+E or by clicking the Zoom Extents ![]() button of View Toolbar. After you have rotated or panned the view, you can always restore EM.Ferma’s standard perspective view using the keyboard’sHome key or by clicking the Perspective View
button of View Toolbar. After you have rotated or panned the view, you can always restore EM.Ferma’s standard perspective view using the keyboard’sHome key or by clicking the Perspective View ![]() button of View Toolbar.
button of View Toolbar.
Grid Settings & Mesh Generation
EM.Cube’s Static Module solves Poisson's equation using the Finite Difference (FD) method. In this numerical method, the computational domain is discretized into a large number of elementary cells, whereby Poisson's differential equation is reduced to a finite difference equation. EM.Ferma uses a fixed-cell grid to discretize the computational domain. You can control the number of cells along the X-, Y- and Z-axes independently. It is important to pay attention to the mesh cell sizes especially when dealing with elongated domain boxes.
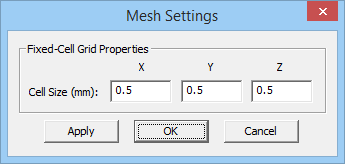
The mesh properties can be accessed by clicking the Mesh Settings ![]() button of the Simulate Toolbar (or using the keyboard shortcut Ctrl+G or via the menu Simulate → Discretization → Mesh Settings). For this tutorial, set the number of cells along all the three directions X, Y and Z to 50 to generate a rather fine mesh.
button of the Simulate Toolbar (or using the keyboard shortcut Ctrl+G or via the menu Simulate → Discretization → Mesh Settings). For this tutorial, set the number of cells along all the three directions X, Y and Z to 50 to generate a rather fine mesh.
To view the mesh, click the Show/Generate Mesh ![]() button of the Simulate Toolbar (or alternatively use the keyboard shortcut Ctrl+M). In general, the mesh view shows how the simulation engine sees your physical structure. You can also display the three mesh grid planes by right clicking on one of the three items XY Grid Plane, YZ Grid Plane, or ZX Grid Plane in the “Discretization” section of the Navigation Tree and selecting Show from the contextual menu. To remove the grid planes from the project workspace, open the same contextual menu and select Hide.
button of the Simulate Toolbar (or alternatively use the keyboard shortcut Ctrl+M). In general, the mesh view shows how the simulation engine sees your physical structure. You can also display the three mesh grid planes by right clicking on one of the three items XY Grid Plane, YZ Grid Plane, or ZX Grid Plane in the “Discretization” section of the Navigation Tree and selecting Show from the contextual menu. To remove the grid planes from the project workspace, open the same contextual menu and select Hide.
Defining Project Observables
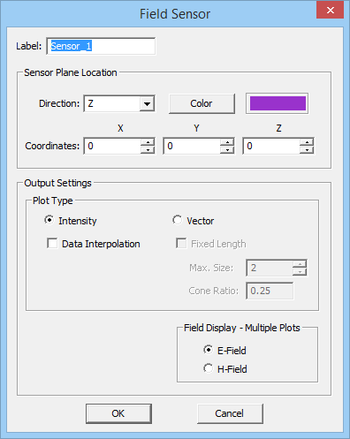
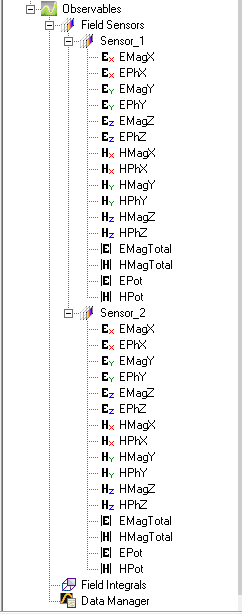
Project observables are output quantities that you would like to compute at the end of an electrostatic simulation. Field sensors are used to visualize the near fields of your structure and the electric potential on a plane parallel to one of the three principal planes. The field sensor planes extend across the entire computational domain. To define a field sensor, right click on the Field Sensors item in the “Observables” section of the Navigation Tree and select Insert New Observable… In the Field Sensor Dialog, enter the point (0, 0, 0) for Coordinates and select Z from the dropdown list labeled "Direction". This means that your field sensor plane will be the XY plane, which passes through the center of the sphere. Accept the other default settings in the dialog box, and select OK to continue. A new entry Sensor_1 is added to the Navigation Tree, and the field sensor is now represented in the project workspace by a purple plane across the computational domain. Next, define a second field sensor observable, this time parallel to the YZ Plane. Repeat the same procedure, and in the Field Sensor Dialog, enter the point (0, 0, 0) for Coordinates and select X from the dropdown list labeled "Direction".
Running the Electrostatic Simulation
At this time, your project is ready for electrostatic simulation. Click the Run ![]() Button of the Simulate Toolbar to open up the Simulation Run Dialog. Or alternatively, use the keyboard shortcut Ctrl+R, or the menu Simulate → Run… The simplest simulation mode in EM.Cube is “Analysis”. In this mode, your physical structure is taken “As Is” and its mesh is passed to the electrostatic simulation engine, along with the necessary information regarding the sources and observables.
Button of the Simulate Toolbar to open up the Simulation Run Dialog. Or alternatively, use the keyboard shortcut Ctrl+R, or the menu Simulate → Run… The simplest simulation mode in EM.Cube is “Analysis”. In this mode, your physical structure is taken “As Is” and its mesh is passed to the electrostatic simulation engine, along with the necessary information regarding the sources and observables.
Before you run your first electrostatic simulation in EM.Cube, let’s take a closer look at the static engine’s settings. Click the Settings button next to the “Select Engine” dropdown list to bring up the Static Engine Settings Dialog box. Currently, there is only one numerical solvers and it is "Gauss-Seidel". The convergence error by default is set to 1e-6 and the maximum number of iterations is set to 10,000. These settings usually suffice for most simulations, and you will keep them intact for this tutorial lesson.
To run the simulation, click the Run button of the Simulation Run Dialog. A separate window pops up displaying messages from the simulation engine. Once the simulation has been completed, you can close the message window and return to the project workspace. The Navigation Tree is now populated with simulation results, most notably under Field Sensors.
Visualizing the Simulation Data
EM.Cube’s computational modules usually generate two types of data: 2D and 3D. 2D data are graphed in EM.Grid. 3D data are visualized in EM.Cube’s project workspace and the plots are usually overlaid on the physical structure.
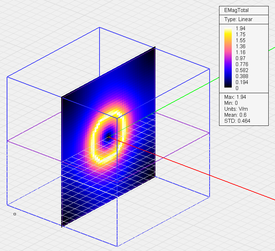
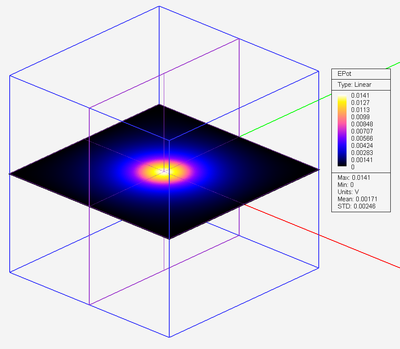
The field sensor section of the Navigation Tree has a list of twelve amplitude and phase plots for all the six field components: Ex, Ey, Ez, and Hx, Hy, Hz. There are also two additional plots for the magnitude of total electric field and total magnetic field as well as the electric potential. In an electrostatic simulation, the magnetic field is assumed to be zero. Therefore, you will only have electric field and electric potential plots. Moreover, both the field and potential are real-valued. To be consistent with EM.Cube's other modules, the field components are plotted in magnitude and phase plots. The electric potential is plotted on a color-coded intensity plots that may involve both negative and positive values. Click on any of these plots to display them in the project workspace. You can use the standard view operations such as dynamic zoom, rotate view, pan view, etc. to better examine these plots.
Verifying Your Simulation Results
Using Gauss' law one can derive the following relationships for the electric field of a uniform spherical charge distribution:
[math] E_r(r) = \frac{\rho}{3\epsilon_0}r, \ \ \ \ \ \ \ r\le a [/math]
[math] E_r(r) = \frac{a^3\rho}{3\epsilon_0} \frac{1}{r^2}, \ \ \ \ \ r\gta [/math]
where a is the radius of the sphere, ρ is the charge density, and ε0 = 8.8542e-12 F/m is the permittivity of the free space. For the spherical charge object you built earlier, at r = 5mm, you will find:
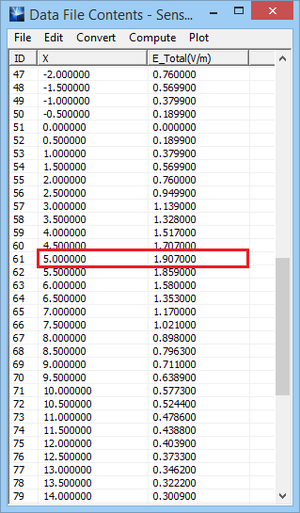
[math] E_r(r = 0.005m) = \frac{1e-8 \times 5e-3}{3 \times 8.8542e-12} = 1.882 V/m [/math]
Besides the color-coded electric field distribution maps, EM.Cube also generated 2D Cartesian graphs of the total electric fields along the crosshairs of the field sensor plane. You can move the crosshairs around by changing the "Coordinate" values in the field sensor dialog. By default, the crosshairs of both Sensor_1 and Sensor_2 which you defined earlier are set at X = Y = 0. The 2D graphs are listed in EM.Cube's Data Manager.
A list of all the 2D output data files generated at the end of a simulation can be viewed in EM.Cube’s Data Manager. To open this dialog, click the Data Manager ![]() button of Simulate Toolbar, or use the keyboard shortcut Ctrl+D, or access the menu Simulate → Data Manager, or right click on the Data Manager item in the “Observables” section of the Navigation Tree and select Open Data Manager…
button of Simulate Toolbar, or use the keyboard shortcut Ctrl+D, or access the menu Simulate → Data Manager, or right click on the Data Manager item in the “Observables” section of the Navigation Tree and select Open Data Manager…
Select the data file “Sensor_1_X_ETotal.DAT” and double-click on it or click the View button of Data Manager to see its contents. You will find a spreadsheet with two columns, one for the X values in the project units and the other for the total electric field along the X-axis in V/m. While “Sensor_1_X_ETotal.DAT” is selected in the Data Manager, click the Plot button to open "EM.Grid". For multiple file selection, use the keyboard’s Ctrl Key, or use the Shift Key to select a range of rows in the list. The total E-field is plotted as functions of the coordinate X on a Cartesian graph in EM.Grid. Note that the field increases linearly from r = 0 to r = 5mm, where it reaches a value of 1.88V/m as we calculated earlier, and it then drops down as 1/r2.
Analyzing Two Spheres of Opposite Charges
In the first part of this tutorial lesson, you examined a spherical charge distribution with a uniform positive charge density of ρ = 1e-8 C/m3. In this part, you will add another charge sphere of the same dimensions but with opposite charge, or more specifically, with a uniform negative charge density of ρ = -1e-8 C/m3. However, in order to create the new charge sphere, you have to define a new charge group because it has a different charge density and cannot belong to CS_1. Follow the same procedure as in the previous part and define a new charge group called CS_2 in the Navigation Tree with a charge density of -1e-8 C/m3. While CS_2 is the active group in the Navigation Tree, draw a new sphere of radius 5mm with its center located at the coordinates (20mm, 0, 0).
As soon as you draw the second sphere, you will notice that the domain box expands automatically to enclose both objects. Since the X dimension of the computational domain has increased substantially, you need to refine the mesh accordingly. Open the mesh settings dialog and set the number of cells along the X direction to 100. Leave the number of cells along the other two directions at 50. Next, open the property dialog of the second field sensor Sensor_2 by right-clicking on its name in the Navigation Tree and selecting Properties.... Change the X-coordinate of the sensor plane to 10mm, placing it midway between the two spheres. Finally, add a third sensor plane called Sensor_3, along the Y directions and with the coordinates (0, 0 , 0). This one will be in the ZX plane.
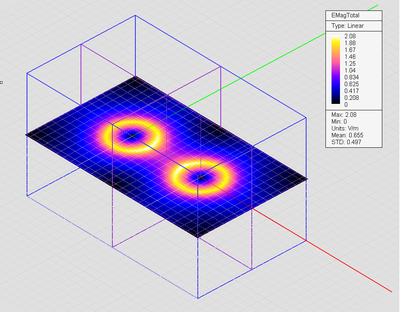
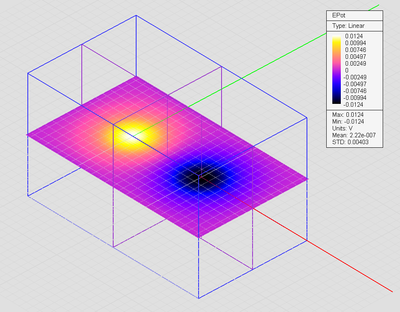
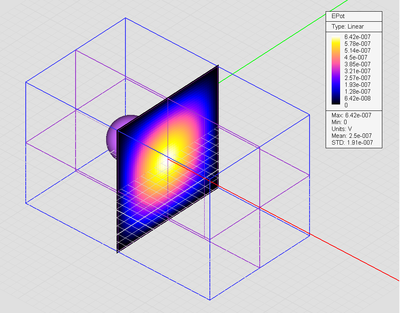
Run an electrostatic simulation of your new structure. This simulation will take longer than the previous one as you increased the volume of the computational domain by a factor of 2. The figures below show that electric fields and electric potentials on the three sensor planes:
Besides color-coded intensity plots, EM.Cube can also visualize field distributions in a vectorial format that often proves to be very insightful. Open the property dialog of the YZ field sensor called Sensor_3 and for the "Plot Type" select the "Vector" option. Set the "Max. Size" (of the vector arrow cones) to 1. You should get a plot like the one below:
