Difference between revisions of "EM.Terrano"
(→Running a Parametric Sweep with SBR) |
|||
| Line 1: | Line 1: | ||
| − | [[File:urban.png]] | + | <!-- Taking out this picture for now for consistency |
| − | + | [[File:urban.png]]--> | |
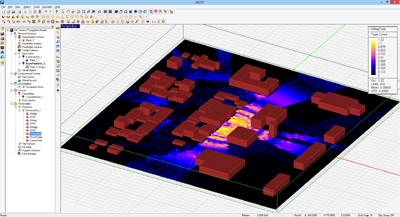
EM.Terrano is a physics-based, site-specific, wave propagation modeling tool that enables engineers to quickly determine how radio waves propagate in urban, natural or mixed environments. The rapid growth of wireless communications along with the high costs associated with the design and deployment of effective wireless infrastructures underline a persistent need for computer aided communication network planning tools. Wireless engineers have long used simplistic statistical prediction models based on measurements that often exhibit considerable errors especially in areas having mixed building sizes. | EM.Terrano is a physics-based, site-specific, wave propagation modeling tool that enables engineers to quickly determine how radio waves propagate in urban, natural or mixed environments. The rapid growth of wireless communications along with the high costs associated with the design and deployment of effective wireless infrastructures underline a persistent need for computer aided communication network planning tools. Wireless engineers have long used simplistic statistical prediction models based on measurements that often exhibit considerable errors especially in areas having mixed building sizes. | ||
Revision as of 14:23, 14 June 2013
EM.Terrano is a physics-based, site-specific, wave propagation modeling tool that enables engineers to quickly determine how radio waves propagate in urban, natural or mixed environments. The rapid growth of wireless communications along with the high costs associated with the design and deployment of effective wireless infrastructures underline a persistent need for computer aided communication network planning tools. Wireless engineers have long used simplistic statistical prediction models based on measurements that often exhibit considerable errors especially in areas having mixed building sizes.
Since its introduction in 2002, EM.Terrano has helped wireless engineers around the globe model the physical channel and the mechanisms by which radio signals propagate from transmitters to receivers. EM.Terrano’s advanced ray tracing simulator finds the dominant propagation paths specific to the site in question. It calculates the true signal characteristics at the actual locations using physical databases of the buildings and terrain at a given site, not those of a statistically average or representative environment. EM.Terrano’s ray tracer is based on the shoot-and-bounce-rays (SBR) method, which utilizes geometrical optics (GO) in combination with uniform theory of diffraction (UTD) models of building edges.
The new EM.Terrano 2013 has been totally reconstructed based on our integrated EM.Cube software foundation. This integration has created the opportunity to inject a host of new powerful features such as a highly customizable terrain generator, DEM terrain import, complex building constructions, and versatile interior wall arrangements for indoor propagation modeling. As a result of this seamless interface with EM.Cube's other modules, you can now model complex antenna systems in EM.Picasso, EM.Tempo or EM.Libera, and generate antenna radiation patterns than can be used to model directional transmitters and receivers at the two ends of your propagation channel. Conversely, you can analyze a propagation scene in EM.Terrano and import the rays received at a certain receiver location as coherent plane wave sources to EM.Picasso, EM.Tempo or EM.Libera. You can also model periodic wall or ground structures using the periodic simulation capability of EM.Picasso or EM.Tempo and generate macromodels for their reflection and transmission coefficients as functions of the ray incidence angles. You can then define buildings or terrains in your propagation scene that are governed by such macromodels.
Contents
- 1 A Wireless Propagation Primer
- 1.1 Free Space Propagation Channel
- 1.2 Multipath Propagation Channel
- 1.3 The SBR Method
- 1.4 Ray Reflection & Transmission
- 1.5 Penetration Through Thin Walls Or Surfaces
- 1.6 Wedge Diffraction From Edges
- 1.7 SBR As An Asymptotic EM Solver
- 1.8 Novelties Of EM.Cube's SBR Solver
- 1.9 Limitations of EM.Cube's SBR Solver
- 2 Anatomy Of A Propagation Scene
- 2.1 The Various Types Of Surfaces & Blocks
- 2.2 Impenetrable Surfaces For Outdoor Scenes
- 2.3 Penetrable Surfaces For Indoor Scenes
- 2.4 Computational Domain & Global Ground
- 2.5 Terrain Surfaces vs. Global Ground
- 2.6 Using Terrain Generator
- 2.7 Generating Grid-Based Terrain
- 2.8 Importing & Exporting Terrain Models
- 2.9 Multilayer Surface Models
- 2.10 Transferring Objects From Or To Other Modules
- 3 Defining Sources & Observables
- 4 Scene Discretization & Adjustment
- 5 Running A SBR Simulation
A Wireless Propagation Primer
Every wireless communication system involves a transmitter that transmits some sort of signal (voice, video, data, etc.), a receiver that receives and detects the transmitted signal, and a channel in which the signal is transmitted into the air and travels from the location of the transmitter to the location of the receiver. The channel is the physical medium in which the electromagnetic waves propagate. The successful design of a communication system depends on an accurate link budget analysis that determines whether the receiver receives adequate signal power to detect it against the background noise. The simplest channel is the free space. Real communication channels, however, are more complicated and involve a large number of wave scatterers. For example, in an urban environment, the obstructing buildings, vehicles and vegetation reflect, diffract or attenuate the propagating radio waves. As a result, the receiver receives a distorted signal that contains several components with different power levels and different time delays arriving from different angles.
The different rays arriving at a receiver location create constructive and destructive interference patterns. This is known as the multipath effect. This together with the shadowing effects caused by building obstructions lead to channel fading. In many wireless applications, the total received power by the receiver is all that matters. In some others, the angle of arrival of the rays as well as their polarization are of immense interest. A fully polarimetric, coherent ray tracer like EM.Cube's Shooting-and-Bouncing-Rays (SBR) solver lets you compute and resolve all the rays received by a receiver including their power levels, time delays and angles of arrival.
Free Space Propagation Channel
In a free-space line-of-sight (LOS) communication system, the signal propagates directly from the transmitter to the receiver without encountering any obstacles (scatterers). Electromagnetic waves propagate in the form of spherical waves with a functional dependence of ej(ωt-k0R)/R, where R is the distance between the transmitter and receiver, [math]\omega = 2\pi f[/math], f is the signal frequency, [math]k_0 = \tfrac{\omega}{c} = \tfrac{2\pi}{\lambda}[/math], c is the speed of light, and λ0 is the free-space wavelength at the operational frequency. By the time the signal arrives at the location of the receiver, it undergoes two changes. It is attenuated and its power drops by a factor of 1/R2, and additionally, it experiences a phase shift of [math]\tfrac{2\pi R}{\lambda_0}[/math], which is equivalent to a time delay of R/c. The signal attenuation from the transmitter to the receiver is usually quantified by Path Loss defined as the ratio of the received signal power (PR) to the transmitted signal power (PT). Assuming isotropic transmitting and receiving radiators (i.e. radiating uniformly in all directions), the Path Loss in a free-space line-of-sight communication system is given by Friis’ formula:
- [math] \frac{P_R}{P_T} = \left( \frac{\lambda_0}{4\pi R} \right)^2 [/math]
The above formula assumes that the receiving antenna is polarization-matched. Normally, there is a polarization mismatch between the transmitting and receiving antennas. In the case of directional transmitting and receiving antennas, Friis’ formula takes the following form:
- [math] \frac{P_R}{P_T} = G_T G_R \left( \frac{\lambda_0}{4\pi R} \right)^2 ( \mathbf{ \hat{u}_T \cdot \hat{u}_R } )[/math]
where uT and uR are the unit polarization vectors of the transmitting and receiving antennas, and GT and GR are their gains, respectively.
Figure: A Line-of-Sight (LOS) Propagation Scenario.
Multipath Propagation Channel
Free-space line-of-sight communications is an ideal scenario that is typically used to model aerial or space applications. In ground-based systems, the presence of the ground as a very large reflecting surface affects the signal propagation to a large extent. Along the path from a transmitter to a receiver, the signal may also encounter many obstacles and scatterers such as buildings, vegetation, etc. In an urban canyon environment with many buildings of different heights and other scatterers, a line of sight between the transmitter and receiver can hardly be established. In such cases, the propagating signals bounce back and forth among the building surfaces. It is these reflected or diffracted signals that are often received and detected by the receiver. Such environments are referred to as “multipath”. The group of rays arriving at a specific receiver location experience different attenuations and different time delays. This gives rise to constructive and destructive interference patterns that cause fast fading. As a receiver moves locally, the receiver power level fluctuates sizably due to these fading effects.
The use of statistical models for prediction of fading effects is widely popular among communication system designers. These models are either based on measurement data or derived from simplistic analytical frameworks. The statistical models often exhibit considerable errors especially in areas having mixed building sizes. In such cases, one needs to perform a physics-based, site-specific analysis of the propagation environment to accurately identify and establish all the possible signal paths from the transmitter to the receiver. This involves an electromagnetic analysis of the scene with all of its geometrical and physical details.
Link budget analysis for a multipath channel is a challenging task due to the large size of the computational domains involved. Typical propagation scenes usually involve length scales on the order of thousands of wavelengths. To calculate the path loss between the transmitter and receiver, one must solve Maxwell's equations in an extremely large space. Full-wave numerical techniques like the Finite Difference Time Domain (FDTD) method, which require a fine discretization of the computational domain, are therefore impractical for solving large-scale propagation problems. The practical solution is to use asymptotic techniques such as SBR, which utilize analytical techniques over large distances rather than a brute force discretization of the entire computational domain. Such asymptotic techniques, of course, have to compromise modeling accuracy for practical computation feasibility.
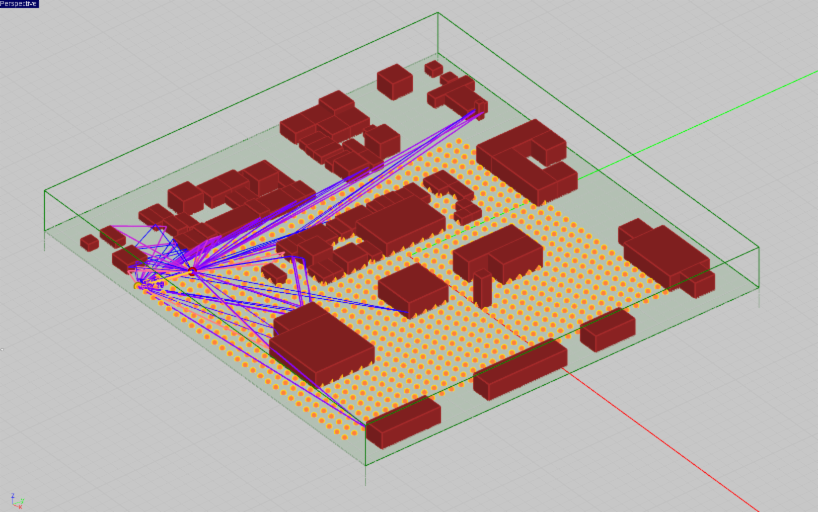
Figure 1: A multipath propagation scene showing all the rays arriving at a particular receiver.
The SBR Method
EM.Cube's Propagation Module provides an asymptotic ray tracing simulation engine that is based on a technique known as Shooting-and-Bouncing-Rays (SBR). In this technique, propagating spherical waves are modeled as ray tubes or beams that emanate from a source, travel in space, bounce from obstacles and are collected by the receiver. As rays propagate away from their source (transmitter), they begin to spread (or diverge) over distance. In other words, the cross section or footprint of a ray tube expands as a function of the distance from the source. EM.Cube uses an accurate equi-angular ray generation scheme to that produces almost identical ray tubes in all directions to satisfy energy and power conservation requirements.
When a ray hits an obstructing surface, one or more of the following phenomena may happen:
- Reflection from the locally flat surface
- Transmission through the locally flat surface
- Diffraction from an edge between two conjoined locally flat surfaces
EM.Cube discretizes all the objects of the scene into flat triangular facets. Obviously, rectangular and cubic objects preserve their geometric shapes through this discretization. Objects with curved surfaces such as cylinders, cones or spheres, are approximated by "polymesh" representations. The geometric fidelity of the resulting mesh depends on the specified mesh edge length. When a ray hits a triangular facet, the propagating spherical wave is approximated as a plane wave at the specular point. The reflection and transmission coefficients of the surface are calculated at the operational frequency and at the particular ray incident angle.
A new reflected ray is generated at the specular point, which starts traveling and bouncing around in the scene. If the obstructing surface is penetrable, a second transmitted ray is generated and added to the scene. If the ray hits the edge of an obstacle, it is diffracted from that edge. This leads to the creation of a cone of new rays, which greatly complicate the computational problem. The Uniform Theory of Diffraction (UTD) is used to calculate the wedge diffraction coefficients at the edges of scattering blocks. Note that reflection, transmission and diffraction coefficients are all dependent on the polarization of the incident plane wave.
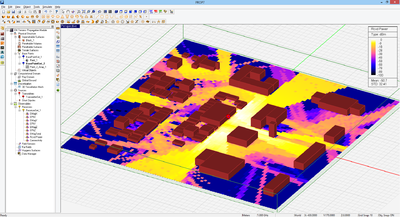
A receiver may receive a large number of rays: direct line-of-sight rays from the transmitter, rays reflected or diffracted off the ground or terrain, rays reflected or diffracted from buildings or rays transmitted through buildings. Each received ray is characterized by its power, delay and angles of arrival, which are the spherical coordinate angles θ and φ of the incoming ray. The actual signal received and detected by the receiver is the superposition of all these rays with different power levels and different time delays. Most of the time, you will be interested in the coverage map of an area, which shows how much power is received by a grid of receivers spread over the area from a given fixed transmitter.
Ray Reflection & Transmission
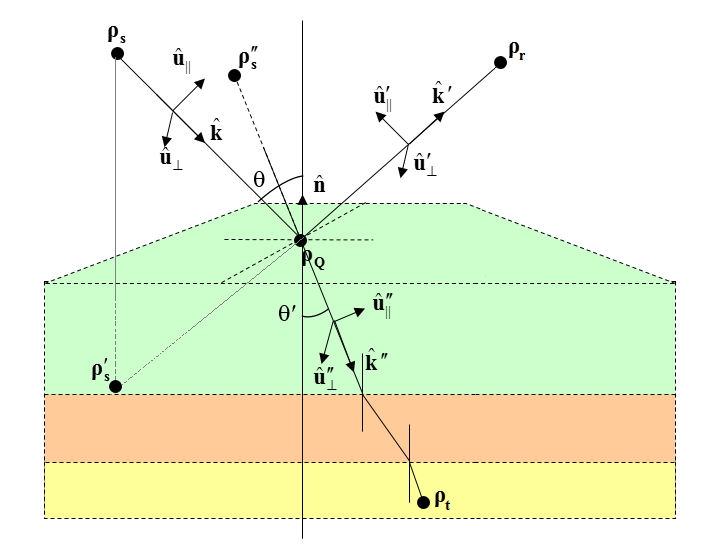
The incident, reflected and transmitted rays are each characterized by a triplet of unit vectors:
- [math]( \mathbf{ \hat{u}_{\|}, \hat{u}_{\perp}, \hat{k} } )[/math] representing the incident parallel polarization vector, incident perpendicular polarization vector and incident propagation vector, respectively.
- [math]( \mathbf{ \hat{u}_{\|}', \hat{u}_{\perp}', \hat{k}' } )[/math] representing the reflected parallel polarization vector, reflected perpendicular polarization vector and reflected propagation vector, respectively.
- [math]( \mathbf{ \hat{u}_{\|}'', \hat{u}_{\perp}'', \hat{k}'' } )[/math] representing the transmitted parallel polarization vector, transmitted perpendicular polarization vector and transmitted propagation vector, respectively.
The Incident, Reflected and Transmitted Rays at the Interface Between Two Dielectric Media
The reflected ray is assumed to originate from a virtual image source point. The three triplets constitute three orthonormal basis systems. Below, it is assumed that the two dielectric media have permittivities ε1 and ε2, and permeabilities μ1 and μ2, respectively. A lossy medium with a conductivity σ can be modeled by a complex permittivity εr = ε'r –jσ/ε0. Assuming n to be the unit normal to the interface plane between the two media, and Z0 = 120Ω , the incident polarization vectors as well as all the reflected and transmitted vectors are found as:
- [math] \mathbf{ \hat{u}_{\perp} = \frac{\hat{k} \times \hat{n}}{|\hat{k} \times \hat{n}|} } [/math]
- [math] \mathbf{ \hat{u}_{\|} = \hat{u}_{\perp} \times \hat{k} } [/math]
The reflected unit vectors are found as:
- [math] \mathbf{ \hat{k}' = \hat{k} - 2(\hat{k} \cdot \hat{n}) \hat{n} } [/math]
- [math] \mathbf{ \hat{u}_{\perp}' = \hat{u}_{\perp} } [/math]
- [math] \mathbf{ \hat{u}_{\|}' = \hat{u}_{\perp}' \times \hat{k}' } [/math]
The transmitted unit vectors are found as:
- [math] \mathbf{ \hat{k}'' = \hat{n} \times a - \sqrt{1-a \cdot a} \; \hat{n} } [/math]
- [math] \mathbf{ \hat{u}_{\perp}'' = \hat{u}_{\perp} } [/math]
- [math] \mathbf{ \hat{u}_{\|}'' = \hat{u}_{\perp}'' \times \hat{k}'' } [/math]
where
- [math] \mathbf{a} = (k_1/k_2) \mathbf{\hat{k} \times \hat{n}}[/math]
- [math] k_1 = k_0 \sqrt{\varepsilon_1 \mu_1} [/math]
- [math] k_2 = k_0 \sqrt{\varepsilon_2 \mu_2} [/math]
- [math] \eta_1 = Z_0 \sqrt{\mu_1 / \varepsilon_1} [/math]
- [math] \eta_2 = Z_0 \sqrt{\mu_2 / \varepsilon_2} [/math]
- [math] \sin\theta'' = \frac{k_1}{k_2}\sin\theta \text{ if } \sin\theta \le k_2/k_1[/math]
The reflection coefficients at the interface are calculated for the two parallel and perpendicular polarizations as:
- [math] R_{\|} = \frac { \eta_2(\mathbf{ \hat{k}'' \cdot \hat{n} }) - \eta_1(\mathbf{ \hat{k} \cdot \hat{n} }) } { \eta_2(\mathbf{ \hat{k}'' \cdot \hat{n} }) + \eta_1(\mathbf{ \hat{k} \cdot \hat{n} }) } = \frac{\eta_2 \cos\theta'' - \eta_1 \cos\theta} {\eta_2 \cos\theta'' + \eta_1 \cos\theta} = \frac{Z_{2\|} - Z_{1\|}} {Z_{2\|} + Z_{1\|}} [/math]
- [math] R_{\perp} = \frac { \eta_2(\mathbf{ \hat{k} \cdot \hat{n} }) - \eta_1(\mathbf{ \hat{k}'' \cdot \hat{n} }) } { \eta_2(\mathbf{ \hat{k} \cdot \hat{n} }) + \eta_1(\mathbf{ \hat{k}'' \cdot \hat{n} }) } = \frac{\eta_2 / \cos\theta'' - \eta_1 / \cos\theta} {\eta_2 / \cos\theta'' + \eta_1 / \cos\theta} = \frac{Z_{2\perp} - Z_{1\perp}} {Z_{2\perp} + Z_{1\perp}} [/math]
Penetration Through Thin Walls Or Surfaces
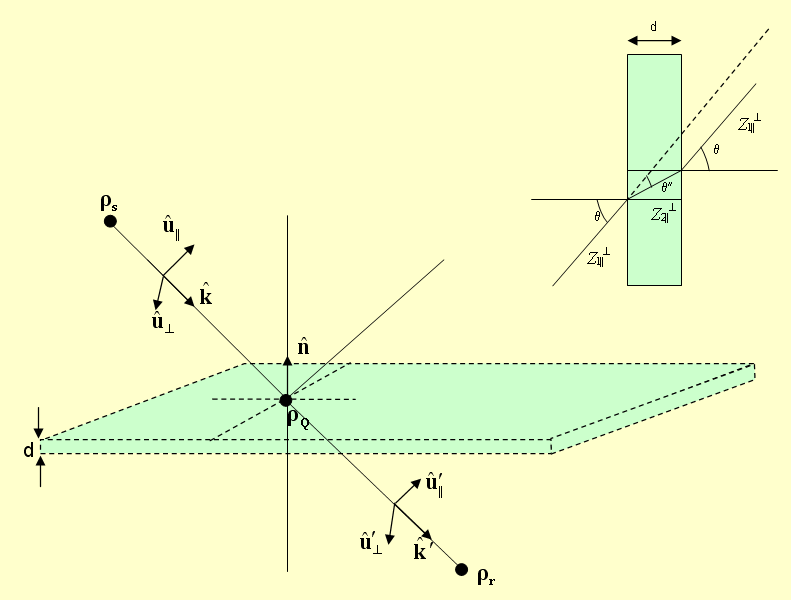
In "Thin Wall Approximation", we assume that an incident ray gives rise to two rays, one is reflected at the specular point, and the other is transmitted almost in the same direction as the incident ray. The reflected ray is assumed to originate from a virtual image source point. Similar to the case of reflection and transmission at the interface between two dielectric media, here too we have three triplets of unit vectors, which all form orthonormal basis systems.
The Incident and Transmitted Rays through a Thin Wall
The transmission coefficients are calculated for the two parallel and perpendicular polarizations as:
- [math] T_{\|} = \frac{(1-{\Gamma_{\|}}^2) \exp(-jk_2 d (\mathbf{ \hat{k}'' \cdot \hat{n}}))} { 1-{\Gamma_{\|}}^2 \exp( -2jk_2 d (\mathbf{ \hat{k}'' \cdot \hat{n} }) ) } [/math]
- [math] T_{\perp} = \frac{(1-{\Gamma_{\perp}}^2) \exp(-jk_2 d (\mathbf{ \hat{k}'' \cdot \hat{n}}))} { 1-{\Gamma_{\perp}}^2 \exp( -2jk_2 d (\mathbf{ \hat{k}'' \cdot \hat{n} }) ) } [/math]
where
- [math] \Gamma_{\|} = \frac { \eta_2(\mathbf{ \hat{k}'' \cdot \hat{n} }) - \eta_1(\mathbf{ \hat{k} \cdot \hat{n} }) } { \eta_2(\mathbf{ \hat{k}'' \cdot \hat{n} }) + \eta_1(\mathbf{ \hat{k} \cdot \hat{n} }) } = \frac{\eta_2 \cos\theta'' - \eta_1 \cos\theta} {\eta_2 \cos\theta'' + \eta_1 \cos\theta} = \frac{Z_{2\|} - Z_{1\|}} {Z_{2\|} + Z_{1\|}} [/math]
- [math] \Gamma_{\perp} = \frac { \eta_2(\mathbf{ \hat{k} \cdot \hat{n} }) - \eta_1(\mathbf{ \hat{k}'' \cdot \hat{n} }) } { \eta_2(\mathbf{ \hat{k} \cdot \hat{n} }) + \eta_1(\mathbf{ \hat{k}'' \cdot \hat{n} }) } = \frac{\eta_2 / \cos\theta'' - \eta_1 / \cos\theta} {\eta_2 / \cos\theta'' + \eta_1 / \cos\theta} = \frac{Z_{2\perp} - Z_{1\perp}} {Z_{2\perp} + Z_{1\perp}} [/math]
Wedge Diffraction From Edges
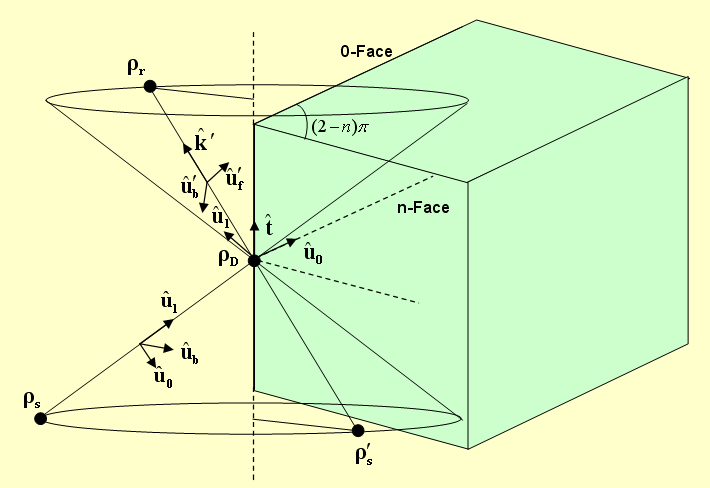
For the purpose of calculation of diffraction from building edges, we define a "Wedge" as having two faces, the 0-face and the n-face. The wedge angle is a = (2-n)p, where the parameter n is required for the calculation of diffraction coefficients. All the diffracted rays lie on a cone with its vertex at the diffraction point and a wedge angle equal to the angle of incidence in the opposite direction. A diffracted ray is assumed to originate from a virtual image source point. Three triplets of unit vectors are defined as follows:
- [math]\mathbf{(\hat{u}_0, \hat{u}_l, \hat{t})}[/math] representing the unit vector normal to the edge and lying in the plane of the 0-face, the unit vector normal to the 0-face, and the unit vector along the edge, respectively.
- [math]\mathbf{(\hat{u}_f, \hat{u}_b, \hat{t})}[/math] representing the incident forward polarization vector, incident backward polarization vector and incident propagation vector, respectively.
- [math]\mathbf{(\hat{u}_f', \hat{u}_b', \hat{t}')}[/math] representing the diffracted forward polarization vector, diffracted backward polarization vector and diffracted propagation vector, respectively.
The three triplets constitute three orthonormal basis systems. The propagation vector k' of the diffracted ray has to be constructed based on the diffraction cone as follows:
- [math] \mathbf{\hat{k}'} = \cos\phi_w \mathbf{\hat{u}_0} + \sin\phi_w \mathbf{\hat{u}_l} + \mathbf{(\hat{k} \cdot \hat{t}) \hat{t}}, \quad 0 \le \phi_w \le \alpha[/math]
where the resolution of the angle θw is chosen to be the same as the resolution of the incident ray.
Figure: The Incident Ray and Diffract Ray Cone at the Edge of a Building
The other unit vectors for the incident and diffracted rays are found as:
- [math] \mathbf{ \hat{u}_f = \frac{\hat{k} \times \hat{t}}{|\hat{k} \times \hat{t}|} } [/math]
- [math] \mathbf{ \hat{u}_b = \hat{k} \times \hat{u}_f } [/math]
- [math] \mathbf{ \hat{u}_f' = \frac{\hat{k}' \times \hat{t}}{|\hat{k}' \times \hat{t}|} } [/math]
- [math] \mathbf{ \hat{u}_b' = \hat{k}' \times \hat{u}_f' } [/math]
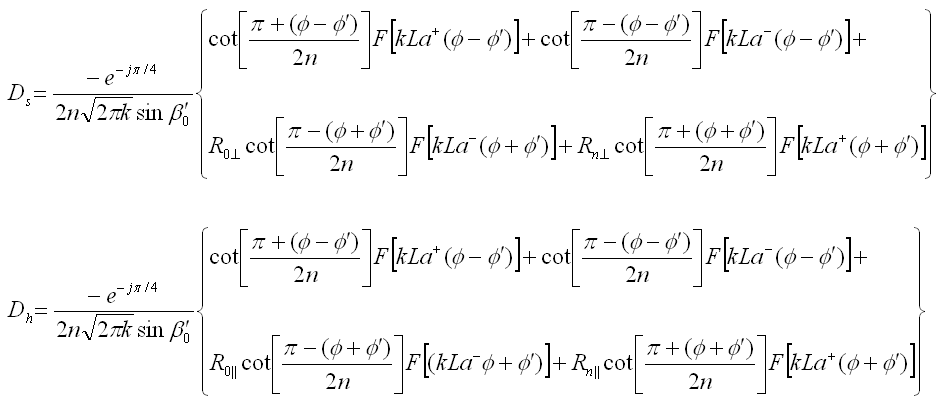
The diffraction coefficients are calculated in the following way:
where F(x) is the Fresnel Transition function:
- [math] F(x) = 2j \sqrt{x} e^{jx} \int_{\sqrt{x}}^{\infty} e^{-j\tau^2} \, d\tau [/math]
In the above equations, we have
- [math] \begin{align} s = |\rho_D - \rho_S| \\ s' = |\rho_D - \rho_r| \end{align} [/math]
- [math]L = \frac{s s' \sin^2 \beta'}{s + s'} [/math]
- [math]a^{\pm}(\nu) = 2\cos^2 \left( \frac{2n\pi N^{\pm} - \nu}{2} \right), \quad \nu = \phi \pm \phi' [/math]
where [math]N^{\pm}[/math] are the integers which most closely satisfy the equations [math] 2n\pi N^{\pm} - \nu = \pm \pi [/math].
SBR As An Asymptotic EM Solver
EM.Cube's SBR simulation engine can be used as a versatile and powerful asymptotic electromagnetic (EM) solver. If you compare EM.Cube's Propagation Module with its other computational modules, you will notice a lot of similarities. While other modules group objects primarily by their material properties, Propagation Module categorizes the types of obstructing surfaces. Besides sharing the same ray-surface interaction mechanisms, all the objects belonging to a surface group also share the same material properties. Propagation Module offers similar source types and similar observable types as the other computational modules. For instance, the Hertzian dipole sources used in a SBR simulation are identical to those offered in PO, MoM3D and Planar modules. The plane wave sources are identical across all computational modules. Propagation Module's sensor field planes, far field observables (either radiation patterns or RCS) and Huygens surfaces are all fully compatible with EM.Cube's other computational modules.
As an asymptotic EM solver, the SBR engine can be used to model large-scale electromagnetic radiation and scattering problems. An example of this kind is radiation of simple or complex antennas in the presence of large scattering platforms. You have to keep in mind that by using an asymptotic technique in place of a full-wave method, you trade computational speed and lower memory requirements for modeling accuracy. In particular, the SBR method cannot take into account the electromagnetic coupling effects among nearby radiators or scatterers. However, when your scene spans thousands of wavelengths, an SBR simulation might often prove to be your sole practical solution.
Novelties Of EM.Cube's SBR Solver
EM.Cube's new SBR simulation engine utilizes an intelligent ray tracing algorithm based on the concept of k-dimensional trees. A k-d tree is a space-partitioning data structure for organizing points in a k-dimensional space. k-d trees are particularly useful for searches that involve multidimensional search keys such as range searches and nearest neighbor searches. In a typical large radio propagation scene, there might be a large number of rays emanating from the transmitter that may never hit any obstacles. For example, upward-looking rays in an urban propagation scene quickly exit the computational domain. Rays that hit obstacles on their path, on the other hand, generate new reflected and transmitted rays. The k-d tree algorithm traces all these rays systematically in a very fast and efficient manner. Another major advantage of k-d trees is the fast processing of multi-transmitters scenes. Unlike the previous versions of the SBR solver which could handle one transmitter at a time and would superpose all the resulting rays at the end of the simulation, the new SBR shoots rays from all the transmitters at the same time.
EM.Cube's new SBR simulation engine performs fully polarimetric and coherent SBR simulations with arbitrary transmitter antenna patterns. The new engine solves directly for the vectorial field components at the receiver locations or field observation points. This is far more rigorous than the previous versions of the SBR solver which primarily utilized ray power calculations based on the two vertical and horizontal polarizations. In other words, EM.Cube's new SBR engine is a truly asymptotic "field" solver. As a result, you can visualize the magnitude and phase of all six electric and magnetic field components at any point in the computational domain. For power calculations at the receiver location, an isotropic, polarization-matched, receiving antenna is assumed.
In most scenes, the buildings and the ground or terrain can be assumed to be made of homogeneous materials. These are represented by their electrical properties such as permittivity e and electric conductivity s. More complex scenes may involve a multilayer ground or multilayer building walls. In such cases, one can no longer use the simple reflection or transmission coefficient formulas for homogeneous medium interfaces. EM.Cube calculates the reflection and transmission coefficients of multilayer structures as functions of incident angle, frequency and polarization and uses them at the respective specular points.
Limitations of EM.Cube's SBR Solver
It is very important to keep in mind that SBR is an asymptotic electromagnetic analysis technique that is based on Geometrical Optics (GO) and the Uniform Theory of Diffraction (UTD). It is not a "full-wave" technique, and it does not solve Maxwell's equations directly or numerically. SBR makes a number of assumptions, chief among them, a very high operational frequency such that the length scales involved are much larger than the operating wavelength. Under this assumed regime, electromagnetic waves start to behave like optical rays. Virtually all the calculations in SBR are based on far field approximations.
In order to maintain a high computational speed for urban propagation problems, EM.Cube's SBR solver ignores double diffractions. Recall that diffractions from edges give rise to a large number of new secondary rays. The power of diffracted rays drops much faster than reflected rays. EM.Cube ignores diffracted rays that are not detected by any receiver. In other words, an edge-diffracted ray does not diffract again from another edge. However, reflected and penetrated rays do get diffracted from edges just as rays emanated directly from the sources do.
Anatomy Of A Propagation Scene
An EM.Cube propagation scene typically consists of several elements. At a minimum, you need a transmitter (Tx) at some location to launch rays into the scene and a receiver (Rx) at another location to receive and collect the incoming rays. A transmitter and a receiver together make the simplest propagation scene, representing a free-space line-of-sight (LOS) channel. A transmitter is one of EM.Cube's several source types, while a receiver is one of EM.Cube's several observable types. A simpler source type is a Hertzian dipole. A simpler observable is a field sensor that is used to compute the electric and magnetic fields on a specified plane.
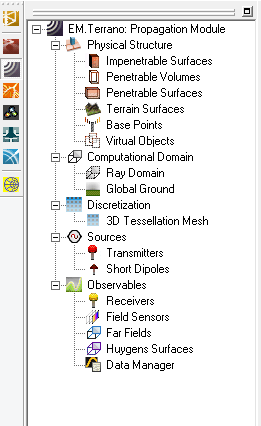
An outdoor propagation scene may involve several buildings (modeled as impenetrable surfaces) and an underlying flat ground or irregular terrain surface. An indoor propagation scene may involve several walls (modeled as thin penetrable surfaces), a ceiling and a floor arranged according to a certain floor plan. You can also build mixed scenes involving both impenetrable and penetrable blocks, possibly along with irregular terrain surfaces. Your sources and observables can be placed anywhere in the scene. Your transmitters and receivers can be placed outdoors or indoors. A complete list of the various elements of a propagation scene is given in the Physical Structure section of Propagation Module's Navigation Tree as follows:
- Impenetrable Surfaces
- Penetrable Surfaces
- Terrain Surfaces
- Base Points
Impenetrable, penetrable and terrain surfaces all obstruct the propagation of electromagnetic waves (rays) in the free space. What differentiates them is the types of physical phenomena that are used to model their interaction with the impinging rays. Base points are simply used to define transmitter and receiver locations in the scene. The following sections of this manual will describe each of these elements in detail.
Figure 1: The Navigation Tree of EM.Cube's Propagation Module.
The Various Types Of Surfaces & Blocks
In a SBR simulation, the propagating rays hit the surface of building structures, walls, terrain (or global ground) and bounce back into the scene (reflection). Some rays penetrate thin walls or other penetrable surfaces and continue their path on the other side of the surface (transmission). The field intensity, phase and power of the reflected and transmitted rays depend on the material properties of the obstructing surface. The specular surface can be modeled as a simple homogeneous dielectric half-space or as a multilayer structure. In that respect, the buildings, walls, terrain or even the global ground all behave in a similar way:
- They terminate an impinging ray and replace it with one or more new rays.
- They represent a specular interface between two media of different material compositions for calculating the reflection, transmission and possibly diffraction coefficients.
EM.Cube has generalized the concept of Block as any object that obstructs and affects radio wave propagation. Rays hit the facets of a block and bounce off the surface of those facets or penetrate them and continue their propagation. Rays also get diffracted off the edges of these blocks. In EM.Cube's Propagation Module, blocks are grouped together by the type of their interaction with rays. EM.Cube currently offers three types of blocks for use in a propagation scene:
- Impenetrable Surfaces: Rays hit the facets of this type of blocks and bounce back, but they do not penetrate the object. It is assumed that the interior of such blocks or buildings are highly absorptive.
- Penetrable Surfaces: These blocks represent thin surfaces that are used to model the exterior and interior walls of buildings based on the "Thin Wall Approximation". Rays reflect off the surface of penetrable surfaces and diffract off their edges. They also penetrate such thin surfaces and continue their paths on the other side of the wall.
- Terrain Surfaces: These blocks are used to provide one or more impenetrable, ground surfaces for the propagation scene. Rays simply bounce off terrain objects. The global ground acts as a flat super-terrain that covers the bottom of the entire computational domain.
EM.Cube's Propagation Module allows you to define block groups of each of the above three types. Each block group has the same color or texture and its members share the same material properties: permittivity εr and conductivity σ. Also, all the penetrable surfaces belonging to the same block group have the same wall thickness. You can define many different block groups with certain properties and underneath each introduce many member objects with different geometrical shapes and dimensions. The table below summarizes the characteristics of each block type:
| Block Type | Physical Effects | Admissible Object Types |
|---|---|---|
| Impenetrable Surface | Reflection, Diffraction | All Solid & Surface CAD Objects |
| Penetrable Surface | Reflection, Diffraction, Transmission | All Solid & Surface CAD Objects |
| Terrain Surface | Reflection | Tessellated Objects Only |
Impenetrable Surfaces For Outdoor Scenes
In outdoor propagation scenes such as "Urban Canyons", you are primarily interested in the wireless coverage in the areas among buildings. You can assume that rays bounce off the exterior walls of these buildings but do not penetrate them. In other words, you ignore the transmitted rays and assume that they are either absorbed or diffused inside the buildings. This is not an unrealistic assumption. EM.Cube offers "Impenetrable Blocks" to model buildings in outdoor propagation scenes. A penetrable block has a color or texture property as well as material properties: permittivity (er) and conductivity (s). By default, a brick building is assumed with εr = 4.4 and σ = 0.001 S/m. Impinging rays are reflected from the facets of impenetrable buildings or diffracted from their edges.
To define a new impenetrable block group, follow these steps:
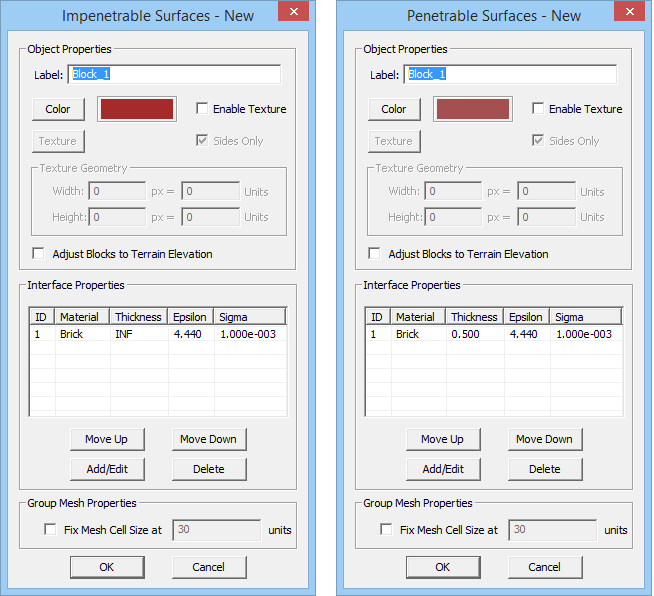
- Right click on either the Impenetrable Surfaces item of the Navigation Tree and select Insert New Block... A dialog for setting up the block properties opens up offering a preloaded material type (Brick) with predefined color and texture.
- Specify a name for the block group and select a color or texture.
- The electromagnetic model that determines ray-block interaction is selected under Specular Interface Type. Two options are available: Standard Material or User Defined Model. The former is the default choice and requires material properties, Permittivity (εr) and Electric Conductivity (σ), which are set to "Brick" by default. No magnetic properties are allowed for blocks.
- Click the OK button of the dialog to accept the changes and close it.
Figure 1: Propagation Module's Impenetrable Surface dialog.
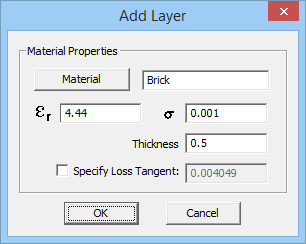
Under an impenetrable block group, you can draw any of EM.Cube's native solid or surface objects or you can import external model files like STEP, IGES or STL. You can change the properties of an impenetrable surface. In the property dialog of the surface group, click on the table that list the properties to select and highlight a row. Then, click the Add/Edit button to open up the "Edit Layer" dialog. In this dialog, you can change the name of the material and its permittivity and electric conductivity. The box labeled "Specify Loss Tangent" is unchecked by default. If you check it, you can specify the Loss Tangent of the material, which, in turn, updates the value of electric conductivity at the center frequency of the project. You can also use EM.Cube's Material List, which will be explained later.
Figure 2: Propagation Module's "Edit Layer" dialog corresponding to impenetrable surfaces.
Penetrable Surfaces For Indoor Scenes
A typical indoor propagation scene usually involves an arrangement of walls that represent the interior of a building. The transmitters and receivers are then placed in the spaces among such walls. From the point of view of EM.Cube's SBR simulator, walls act like thin penetrable surfaces. EM.Cube uses the "Thin Wall Approximation" to model penetrable surfaces. It assumes that rays simply penetrate a wall and exit at the same specular point on the opposite side of the wall. In other words, rays are not displaced by the walls, nor do they get trapped inside the walls (no internal reflection). This is equivalent to assuming a zero thickness for penetrable surfaces for the purpose of geometrical ray tracing, while the finite thickness of the "thin" surface is used for electromagnetic calculation of transmission coefficient. EM.Cube offers "Penetrable Surface Blocks" for the construction of rooms in indoor propagation scenes as well as modeling of hollow buildings and other structures. You can define many penetrable surface groups with arbitrary thicknesses and material properties (color, texture, permittivity and electric conductivity).
To define a new penetrable surface group, follow these steps:
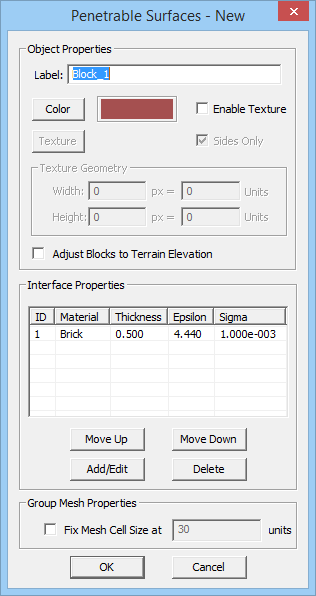
- Right click on one of the Penetrable Surfaces item in the Navigation Tree and select Insert New Block... A dialog for setting up the wall properties opens up offering a preloaded material type (Brick) with predefined color and texture.
- Specify a name for the surface group and select a color or texture.
- The properties of a penetrable surface are identical to those of an impenetrable surface, plus an additional thickness property.
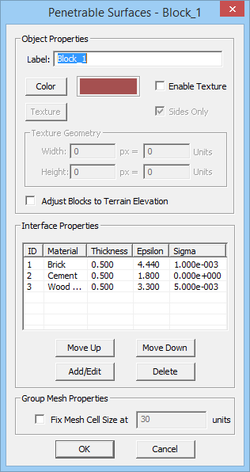
- By default, a brick wall with a thickness of 0.5 units is assumed. You can change the Thickness of the penetrable surface as well as its Permittivity εr and Electric Conductivity σ.
- Click the OK button of the dialog to accept the changes and close it.
Figure 1: Propagation Module's Penetrable Surface dialog.
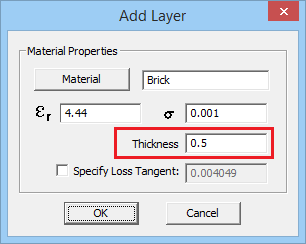
Under a penetrable surface group, you can draw any of EM.Cube's native solid or surface objects or you can import external model files like STEP, IGES or STL. You can change the properties of a penetrable surface group including its default thickness. In the property dialog of the surface group, click on the table that list the properties to select and highlight a row. Then, click the Add/Edit button to open up the "Edit Layer" dialog. Similar to the case of impenetrable surfaces, from this dialog, you can change the material properties (permittivity and electric conductivity) as well as Thickness, which is expressed in the project units. You can also use EM.Cube's Material List, which will be explained later.
Figure 2: Propagation Module's "Edit Layer" dialog corresponding to penetrable surfaces.
You can construct several thin walls and arrange them as rooms. A regular room can be built by placing four vertical wall objects together with an optional horizontal wall at the top for the ceiling. Alternatively, you may use EM.Cube's hollow box objects or boxes with one or two capped end(s). Keep in mind that all the penetrable surfaces belonging to a group have the same wall thickness, which is initially set to 0.5 project units by default. Also, note that solid CAD objects belonging to a penetrable surface group are treated as air-filled hollow structures. The thickness of penetrable surfaces is implied and not visualized when displaying objects in the project workspace.
Computational Domain & Global Ground
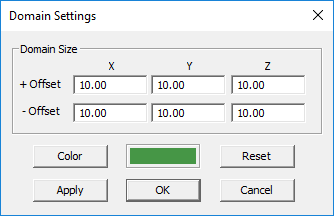
The SBR simulation engine requires a finite computational domain. All the stray rays that hit the boundaries of this finite domain are terminated during the simulation process. Such rays exit the computational domain and travel to the infinity, with no chance of ever reaching any receiver in the scene. When you define a propagation scene with various elements like buildings, walls, terrain, etc., a dynamic domain is automatically established and displayed as a wireframe box with green lines that surrounds the entire scene. Every time you create a new object, the domain is automatically adjusted and extended to enclose all the objects in the scene. You can change the size and color of the domain box through the Ray Domain Settings Dialog, which can be accessed in one of the following three ways:
- Click the Domain
 button of the Simulation Toolbar.
- Select the Simulate > Computational Domain > Settings... item of the Simulate Menu.
- Right click on the Ray Domain item of the Navigation Tree and select Domain Settings...
- Use the keyboard shortcut Ctrl + A.
The size of the Ray domain is specified in terms of six Offset parameters along the ±X, ±Y and ±Z directions. The default value of all these six offset parameters is 10 project units. You can change them arbitrarily. After changing these values, use the Apply button to make the changes effective while the dialog is still open.
Figure 1: Propagation Module's Domain Settings dialog.
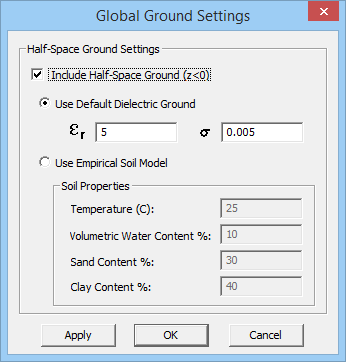
Most outdoor and indoor propagation scenes include a flat ground at their bottom, which bounces incident rays back into the scene. EM.Cube's Propagation Module provides a global flat ground at z = 0. The global ground indeed acts as an impenetrable surface that blocks the entire computational domain from the z = 0 plane downward. It is displayed as a translucent green plane at z = 0 extending downward. The color of the ground plane is always the same as the color of the ray domain. The global ground is assumed to be made of a homogeneous dielectric material with a specified permittivity εr and electric conductivity σ. By default, a rocky ground is assumed with εr = 5 and σ = 0.005 S/m. You can remove the global ground, in which case, you will have a free space scene. To disable the global ground, open up the Global Ground Settings Dialog, which can be accessed by right clicking on the Global Ground item in the Navigation Tree and selecting Global Ground Settings... Remove the check mark from the box labeled "Include Half-Space Ground (z<0)" to disable the global ground. This will also remove the green translucent plane from the bottom of your scene. You can also change the material properties of the global ground and set new values for the permittivity and electric conductivity of the impenetrable, half-space, dielectric medium. Do not forget to disable the global ground if you want to model a free space propagation scene.
Figure 2: Propagation Module's Global Ground Settings dialog.
Terrain Surfaces vs. Global Ground
A terrain surface acts as a custom, unlevel or irregular ground for your propagation scene. EM.Cube's default global ground blocks the z < 0 half-space everywhere in the computational domain. You can simply turn off the global ground and create one or more terrain objects and place them arbitrarily in the scene. You can also import an external terrain model or file. A terrain represents an impenetrable surface with a more complex surface profile. You can have one or more terrain objects of finite extents and place them on or above the global ground.
Terrain objects have some important differences with objects of the "Impenetrable Surface" type:
- While impenetrable blocks can be created using any of EM.Cube's solid or surface CAD object creation tools, terrain objects are created either using EM.Cube's Terrain Generator or by importing an external terrain file.
- Terrain objects belong to a special type of CAD objects called "Tessellated Objects", which differ from other regular CAD surface objects or EM.Cube's polymesh surfaces.
- Terrain surfaces do not diffract impinging rays at their many small edges.
- Terrain objects affect the elevation of other objects or transmitters or receivers that are located above them.
Just as other blocks are grouped by their color, texture and material composition, terrain objects are also grouped in a similar fashion. Before you can generate or import a new terrain object, first you have to define a terrain group and specify its color/texture and material properties. To define a new terrain group, follow these steps:
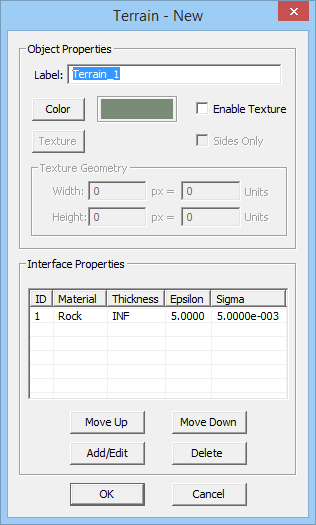
- Right click on the Terrain item in the Navigation Tree and select Insert New Terrain... A dialog for setting up the terrain properties opens up offering a of preloaded material type (Rock) with predefined green color and no texture.
- Specify a name for the terrain group and select a color or texture.
- Similar to other blocks, you have to specify the material properties, Permittivity (εr) and Electric Conductivity (σ), of the terrain group. Rock with εr = 5 and σ = 0.005 S/m is the default material choice for a new terrain.
- Click the OK button of the dialog to accept the changes and close it.
Figure 1: Propagation Module's Terrain dialog.
You can change the properties of a terrain surface group from its property dialog. Click on the table that list the properties to select and highlight a row. Then, click the Add/Edit button to open up the "Edit Layer" dialog, which is identical to the case of impenetrable surfaces. You can also use EM.Cube's Material List, which will be explained later. When a new terrain type is created, its node on the Navigation Tree becomes active. Under this node you can create and add new terrain objects. When a terrain node is active for drawing, all CAD object creation tools are disabled. You have three options for creating a new terrain object, which will be described in detail in the next sections of this manual:
- Use EM.Cube's Terrain Generator.
- Import an external terrain file of ".TRN" type.
- Import an external terrain file of ".DEM" type.
Using Terrain Generator

EM.Cube provides a convenient and powerful Terrain Generator for creating a variety of terrain surface objects. EM.Cube's Terrain Generator looks very similar to CubeCAD's Surface Generator. However, whereas the Surface Generator creates a generic or polymesh surface object, Terrain Generator always creates another special type of object known as a Tessellated Object. A terrain object is much simpler than EM.Cube's polymesh objects and is usually made up of triangular or quadrilateral facets. As such, terrain objects have limited editing capabilities. For example, you can cut, copy, paste, translate or rotate terrain objects. But operations like scaling, mirroring, grouping (composite), arraying, exploding, linking or Boolean operations do not work on terrain objects.
To create a new terrain object using Terrain Generator, first you need to define a terrain group in the Navigation Tree. Right click on the name of the terrain node and select Terrain Generator... from the contextual menu. This opens up the Terrain Generator Dialog. Using Terrain Generator, you can build a single terrain surface or an array of surfaces patched together. Some of the available terrain models include:
- Flat Plane
- Hill (Elliptic Quadratic)
- Mountain (Elliptic Cone)
- 1-D and 2-D Cliff
- Gaussian Hump
- Undulated Sinusoid
- Undulated Sinc
- Super-quadratic Plateau
- Custom Function
- XY Grid Data
In all of the above models, you can set the height of the surface object to an any desired value. You set the lateral extents of the surface and its resolution along the X and Y directions in the boxes labeled Range Start, Range Stop and Range Step. The step values along the X and Y directions are a measure of surface smoothness: the smaller the step values, the higher the resolution and the smoother the resulting terrain object.
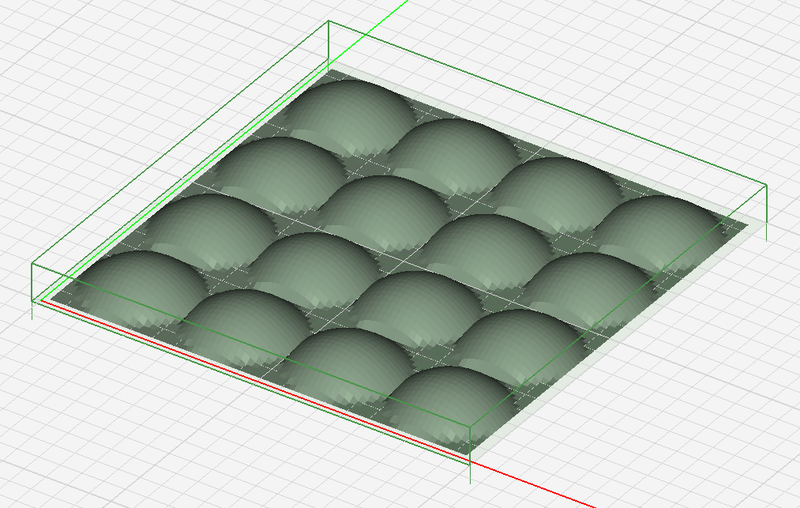
Some surface types have an additional shape factor called Alpha that is identical to the alpha parameter in the surface generator. For example, a Gaussian Hump is defined as exp(-r2/(2a2)), where r is the polar radius. For a Super-quadratic Hump, the input parameter a defines the degree of the super-quadratic surface. a = 2 corresponds to an ellipsoid. Larger values of a get close to a rectangular base with rounded corners. An undulated sinusoidal surface is defined by cos(pax/Dx)*cos(pay/Dy), and an undulated sinc is defined by Dx*Dy*sin(pax/Dx)*sin(pay/Dx)/(2pxy), where Dx and Dy are the X and Y dimensions, respectively. Terrain Generator creates a unit cell based on the specified surface type. From the same dialog, you can also produce an array arrangement of such unit cells. Simply enter any number of elements along the X and Y directions in the boxes labeled Array.
Figure: A 4 × 4 array of hill terrain objects.
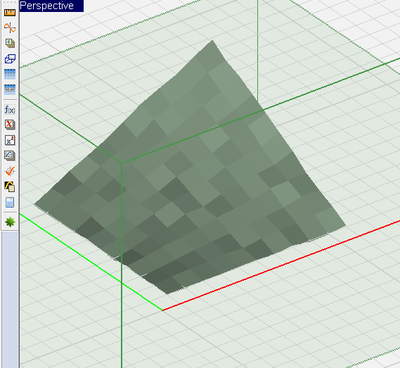
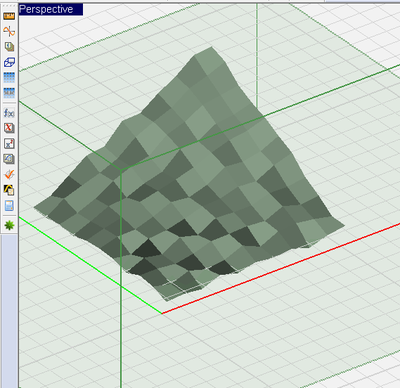
You can define any arbitrary surface by entering an equation of the two variables x and y as z = f(x,y). In this case, you have to select the Custom Function option in the dropdown list labeled Model. You should enter your equation as any mathematical expression in the box labeled Function f(x,y). You can use any of EM.Cube's mathematical functions listed in the Function Dialog or combine several of them. Note that after selecting the custom function option, the height of the surface is determined by your equation, and the Height box is disabled. You can also introduce random noise and create a rough terrain. You can do this by setting a nonzero value for Noise, which represent the RMS peak-to-valley amplitude of the surface roughness. The figures below show two custom terrain surfaces modeled by the equation z = (x.y)/20 defined over the range [0, 10] in both X and Y directions. Random noise has been added to both surfaces, with the noise amplitude being 0.2 and 0.5 for the left and right figures, respectively.
Figure: Two noisy custom terrain surfaces both defined as z = (x.y)/20: (Left) RMS noise amplitude = 0.2, (right) RMS noise amplitude = 0.5.
Generating Grid-Based Terrain
Every time you create a new terrain object using Terrain Generator, an ASCII data file named "GeneratedTerrain" with a ".TRN" file extension is created and placed in your project folder. This is EM.Cube's simple native terrain file format that basically lists all the (x, y, z) coordinates of the generated surface points on a horizontal, rectangular XY grid. Terrain Generator simply takes your custom function definition or one of the selected catalog surface types and generates the digital elevation data on the specified grid.
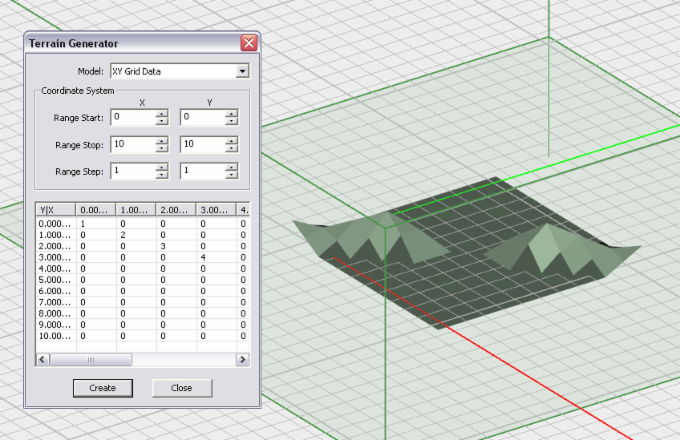
Another type of terrain model that the terrain generator provides is XY Grid Data. In this case, you define a rectangular XY grid with a uniform grid cell size along the X and Y directions and manually define the Z-elevation for each grid point. This is similar to the surface generator's "2D Uniform Grid" model type in CubeCAD. Based on your input to Range Start, Range Stop and Range Step along X and Y, a 2D grid is set up and displayed in a table at the bottom of the terrain generator dialog. By default, all the Z-elevations are set to zero initially. You can click on each table cell and overwrite it with a new value. At the end, click the Create button of the dialog to add the new grid-based terrain object to the Navigation Tree.
A grid-based terrain object.
Importing & Exporting Terrain Models
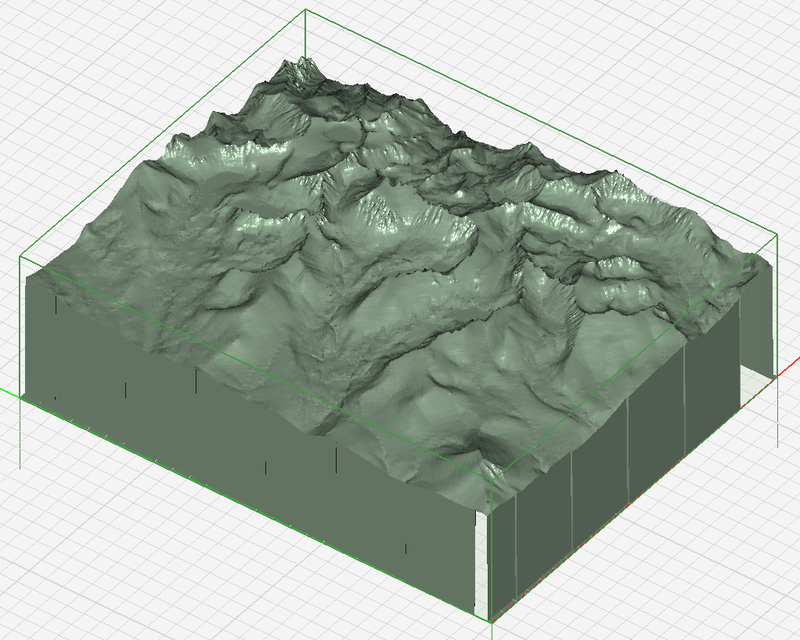
You can import two types of terrain in EM.Cube's Propagation Module. The first type is ".TRN" terrain file, which is EM.Cube's native terrain format. It is a basic digital elevation map with a very simple ASCII data file format. The resolution of the terrain map in the X and Y directions is specified in meters as STEPS. The (x, y, z) coordinates of the terrain points are then listed one point per line. The other type of terrain format supported by EM.Cube is the standard 7.5min DEM file format with a .DEM file extension.
To import an external terrain model, first you have to create a terrain group node in the Navigation Tree. Right click on the name of the terrain group in the Navigation Tree and select either Import Terrain... or Import DEM File... A standard Windows Open Dialog opens up, with the file type set to .TRN or .DEM extensions, respectively. You can browse your folders and find the right terrain model file to import.
You can also export all the terrain objects in the project workspace as a terrain file with a .TRN file extension. You can even import a DEM terrain model from an external file and then save and export it as a native terrain (.TRN) file. To export the terrain, select File > Export... from Propagation Module's File Menu. The standard Windows Save Dialog opens up with the default file type set to .TRN. Type in a name for your new terrain file and click the Save button to export the terrain data.
Figur: An imported external terrain model.
Multilayer Surface Models
Most of the time, your outdoor propagation scene consists of simple buildings made of single-layer walls with standard material properties (εr and σ). In the case of a single-layer impenetrable surface, the specular interface is an infinite dielectric half-space, which reflects the impinging rays. Single-layer penetrable surfaces, on the other hand, involve finite-thickness dielectric walls, which both reflect and transmit the incident rays. Similarly, most of your indoor propagation scenes involve simple single-layer penetrable walls with the specified material properties εr and σ. A thin wall acts like a finite-thickness dielectric slab that both reflects and transmits incident rays. In the case of the global ground or terrain objects, only ray reflection off the ground surface is considered.
In EM.Cube's Propagation Module, you can define multilayer surfaces with both reflection and transmission properties. You can define multilayer impenetrable buildings, multilayer penetrable walls, and multilayer terrain, with an arbitrary number of layers having different material compositions. You define a multilayer surface in the property dialog of a block, whether impenetrable, penetrable or terrain. In the section entitled Surface Type, two options are available: Standard Material or User Defined Model. For simple multilayer walls, select the Standard Material option. You can add new layers with arbitrary thickness and material parameters to the existing layers. To insert a new layer, deselect any items in the layer list, and click the Add/Edit button to open the "Add Layer" Dialog. Here you can enter a name for the new layer and values for its Thickness, εr and σ. You may also delete any layer by selecting and highlighting it and clicking the Delete button. You can move layers up or down using the Move Up and Move Down buttons and change the layer hierarchy.
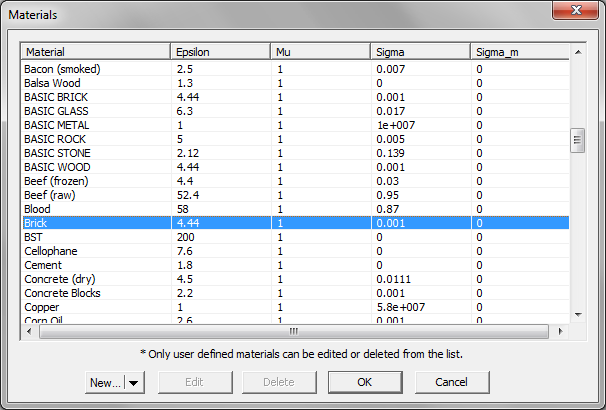
You can also search EM.Cube's material database by clicking the Material button of "Add Layer" or "Edit Layer" dialogs. This opens the Materials Dialog. Inside the material list select and highlight any row and click the OK button. The selected material will fill out all the fields in the "Add Layer" or "Edit Layer" dialogs. Inside the Materials Dialog, you can type the few first letters of any material, and it will take you to the corresponding row of the list.
Figure: EM.Cube's material list.
Transferring Objects From Or To Other Modules
When you start a new project in EM.Cube's Propagation Module and draw a solid object like a box in the project workspace without having defined any surface groups, it is assumed to be of the impenetrable surface type. A default impenetrable surface group called Block_1 is automatically added to the Navigation Tree, which holds your newly drawn object. The default group has the material properties of "Brick" (εr = 4.4 and σ = 0.001 S/m.) with a dark brown color. You can continue drawing new objects in the project workspace and adding them under this block node. Or you can define a new surface type with different properties. By default, the last surface group that was defined is Active. The current active surface group is always listed in bold letters in the Navigation Tree. When you draw a new object, it is always inserted under the current active surface group. Any surface group can be activated by right clicking its name in the Navigation Tree and selecting the Activate item of the contextual menu.
You can move any object from its current surface group into any other available surface group. First select the object, then right click on its surface and select MoveTo > Propagation >. A submenu appears which lists all the available surface groups where you can transfer the selected object. You can also move objects among surface groups by selecting their names in the Navigation Tree and using the contextual menu. In a similar way, you can transfer objects from Propagation Module to EM.Cube's other modules or vice versa. Keep in mind that all the external model files such as STEP, IGES, STL, etc. are first imported to EM.Cube's CubeCAD, from which you can transfer them to other modules. First select the object, then right click and select MoveTo >. In the submenu you will see a list of all the EM.Cube modules that have at least one available group where you can transfer your selected object. You can select multiple objects for transfer. When using the keyboard's Shift Key or Ctrl Key for multiple selection, make sure that those keys are held down, when you right click to access the contextual menu.
Defining Sources & Observables
Like every other electromagnetic solver, EM.Cube's SBR ray tracer requires a source for excitation and one or more observables for generation of simulation data. EM.Cube's new Propagation Module offers several types of sources and observables for a SBR simulation. You can mix and match different source types and observable types depending on the requirements of your modeling problem. There are two types of sources:
There are four types of observables:
- Receivers
- Field Sensor
- Far Fields
- Huygens Surface
The simplest SBR simulation can be performed using a short dipole source with a specified field sensor plane. In this way, EM.Cube computes the electric and magnetic fields radiated by your dipole source in the presence of your multipath propagation environment. A "classic" urban propagation scene can be set up using a "Transmitter" source and an array of "Receiver" observables. A transmitter is a point radiator with a user defined radiation pattern. A receiver is a polarization-matched isotropic point radiator that collects the received rays at its aperture. Using receivers, you can calculate the received power coverage map of your propagation scene. You can also calculate your channel's path loss between the transmitter and all the receivers.
Hertzian Dipole Sources

Earlier versions of EM.Cube's Propagation Module used to offer an isotropic radiator with vertical or horizontal polarization as the simplest transmitter type. This release of EM.Cube has abandoned isotropic radiator transmitters because they do not exist physically in a real world. Instead, the default transmitter radiator type is now a Hertzian dipole. Note that before defining a transmitter, first you have to define a base set to establish the location of the transmitter. Most simulation scenes involve only a single transmitter. Your base set can be made up of a single point for this purpose.
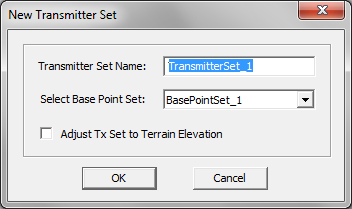
To define a new Transmitter Set, go to the Sources section of the Navigation Tree, right click on the Transmitters item and select Insert Transmitter... A dialog opens up that contains a default name for the new Transmitter Set as well as a dropdown list labeled Select Base Set. In this list you will see all the available base sets already defined in the project workspace. Select the desired base set to associate with the transmitter set. Note that if the base set contains more than one point, then more than one transmitter will be created and contained in your transmitter set. After defining a transmitter set, the base points change their color to the transmitter color, which is red by default.
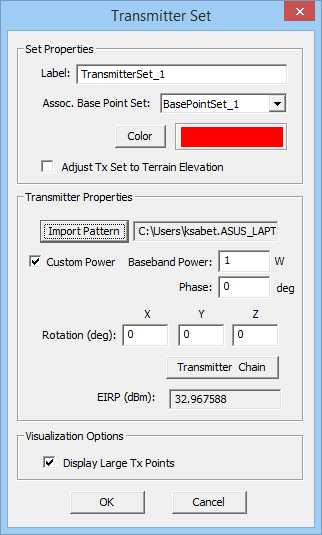
In the "Radiator" section of the dialog, you have two options to choose from: "Short Dipole" and "User Defined". The default option is short dipole. A short dipole radiator has a Lengthdl expressed in project units, a current Amplitude in Amperes and a current Phase in degrees. The Direction of the dipole is determined by its unit vector that has three X, Y and Z components. By default, a Z-directed short dipole radiator is assumed. You can change all parameters of the dipole as you wish. Keep in mind that all the transmitters belonging to the same set have parallel radiators with identical properties.
Defining Base Point Sets

In order to tie up transmitters and receivers with CAD objects in the project workspace, EM.Cube uses point objects to define transmitters and receivers. These point objects represent the base of the location of transmitters and receivers in the computational domain. Hence, they are grouped together as "Base Sets". You can easily interchange the role of transmitters and receivers in a scene by switching their associated bases. The usefulness of concept of base sets will become apparent later when you place transmitters or receivers on an irregular terrain and adjust their elevation.
To create a new base set, right click on the Base Sets item of Navigation Tree and select Insert Base Set... A dialog for setting up the Base Set properties opens up.
- Enter a name for the base set and change the default blue color if you wish. It is useful to differentiate the base sets associated with transmitters and receivers by their color.
- Click the OK button to close the Base Set Dialog.
Once a base set node has been added to the Navigation Tree, it becomes the active node for new object drawing. Under base sets, you can only draw point objects. All other object creation tools are disabled. A point is initially drawn on the XY plane. Make sure to change the Z-coordinate of your radiator, otherwise, it will fall on the global ground at z = 0. You can also create arrays of base points under the same base set. This is particularly useful for setting up receiver grids to compute coverage maps. Simply select a point object and click the Array Tool of Tools Toolbar or use the keyboard shortcut "A". Enter values for the X, Y or Z spacing as well as the number of elements along these three directions in the Array Dialog. In most propagation scenes you are interested in 2D horizontal arrays along a fixed Z coordinate (parallel to the XY plane).
Defining Transmitter Sets
A short dipole is the closest thing to an omni-directional radiator. The direction or orientation of the short dipole determines its polarization. In many applications, you may rather want to use a directional antenna for your transmitter. You can model a radiating structure using EM.Cube's FDTD, Planar, MoM3D or PO modules and generate a 3D radiation pattern data file for it. These data are stored in a specially formatted file with a ".RAD" extension, which contains columns of spherical φ and θ angles as well as the real and imaginary parts of the complex-valued far field components Eθ and Eφ. The θ- and φ-components of the far-zone electric field determine the polarization of the transmitting radiator.
To define a directional transmitter radiator, you need to select the "User Defined" option in the "Radiator" section of the Transmitter Dialog. You can do this either at the time of creating a transmitter set, or afterwards by opening the property dialog of the transmitter set. In the "Custom Pattern Parameters", click the Import Pattern button to set the path for the radiation data file. This opens up the standard Windows Open dialog, with the default file type or extension set to ".RAD". Browse your folders to find the right data file. A radiation pattern file usually contains the value of "Total Radiated Power" in its file header. This is used by default for power calculations in the SBR simulation. However, you can check the box labeled "Custom Power" and enter a value for the transmitter power in Watts. EM.Cube can also rotate the imported radiation pattern arbitrarily. In this case, you need to specify the Rotation angles in degrees about the X-, Y- and Z-axes. Note that these rotations are performed sequentially and in order: first a rotation about the X-axis, then a rotation about the Y-axis, and finally a rotation about the Z-axis.
Figure 1: Propagation Module's Transmitter dialog with a user defined radiator selected.
Multiple Transmitters vs. Antenna Arrays
EM.Cube's SBR simulations are fully coherent and 3D-polarimetric. This means that the phase and polarization of all the rays are maintained and processed during their bounces in the scene. Your propagation scene can have more than one transmitter. During an SBR simulation, all the rays emanating from all the transmitters are traced in the propagation scene. All the received rays at a given receiver location are summed coherently and vectorially. This is based on the principle of linear superposition. All the transmitters belonging to the same transmitter set have the same radiation properties. They are either parallel short dipole radiators with the same current amplitudes and phases, or parallel user defined radiators with identical radiation patterns. As these transmitters are placed at different spatial locations, they effectively form an antenna array with identical elements. The array factor is simply determined by the coordinates of the base points. If you want to have different amplitude or phases, then you need to define different transmitter sets.
If that radiators are indeed the elements of an actual antenna array with a half wavelength spacing or so, we recommend that you import the radiation pattern of the array structure instead and replace the whole multi-radiator system with a single point transmitting radiator in your propagation scene. This case is usually encountered in MIMO systems, and using an equivalent point transmitter is an acceptable approximation because the total size of the array aperture is usually much smaller than the dimensions of your propagation scene and its representative length scales. In that case, you need to position the equivalent point radiator at the radiation center of the antenna array. This depends on the physical structure of the antenna array. However, keep in mind that any reasonable guess may still provide a good approximation without any significant error in the received ray data.
Defining Receiver Sets
Receivers act as observables in a propagation scene. The objective of a SBR simulation is to calculate the far-zone electric fields and the total received power at the location of a receiver. In that sense, receivers indeed act as field observation points. You need to define at least one receiver in the scene before you can run a SBR simulation. You define the receivers of your scene by associating them with the base sets you have already defined in the project workspace. Unlike transmitters that usually one or few, a typical propagation scene may involve a large number of receivers. To generate a wireless coverage map, you need to define an array of points as your base set.
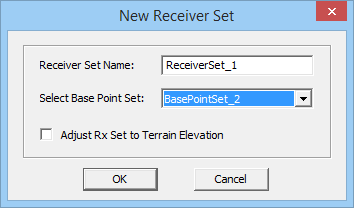
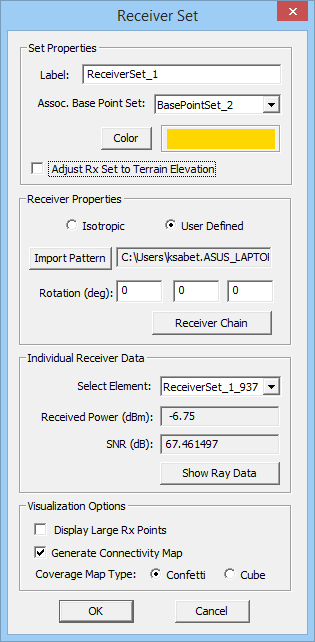
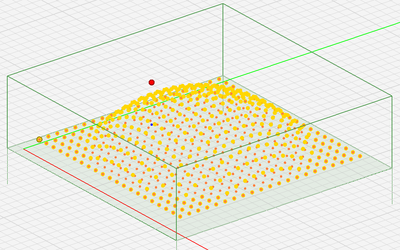
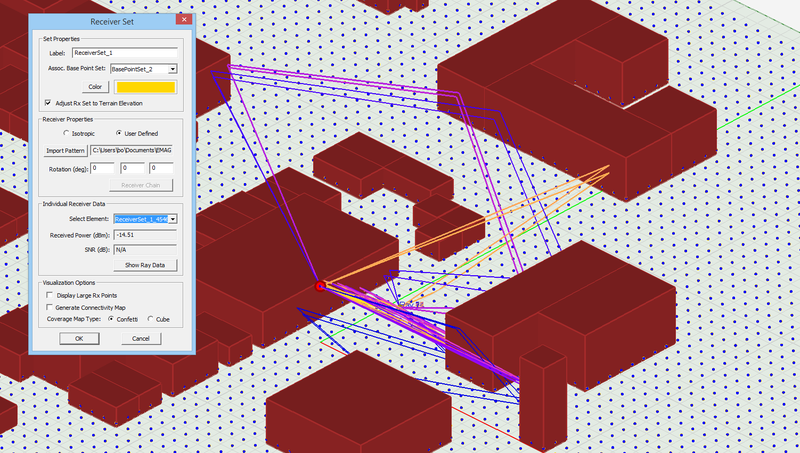
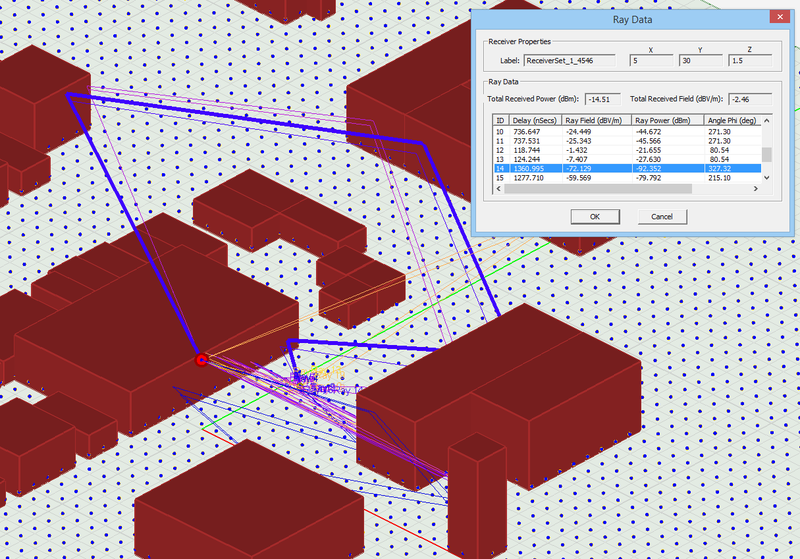
To define a new Receiver Set, go to the Observables section of the Navigation Tree, right click on the Receivers item and select Insert Receiver... A dialog opens up that contains a default name for the new Receiver Set as well as a dropdown list labeled Select Radiator Set. In this list you will see all the available base sets that you have already define in the project workspace. Select and designate the desired base set as the receiver set. Note that if the base set contains more than one point, all of them are designated as receivers. After defining a receiver set, the points change their color to the receiver color, which is yellow by default. The first element of the set is represented by a larger ball of the same color indicating that it is the selected receiver in the scene. The Receiver Set Dialog is also used to access individual receivers of the set for data visualization at the end of a simulation. At the end of an SBR simulation, the button labeled "Show Ray Data" becomes enabled. Clicking this button opens the Ray Data Dialog, where you can see a list of all the received rays at the selected receiver and their computed characteristics.
Figure 1: Propagation Module's Receiver dialog.
Defining Field Sensors

As an asymptotic electromagnetic field solver, the SBR simulation engine can compute the electric and magnetic field distributions in a specified plane. In order to view these field distributions, you must first define field sensor observables before running the SBR simulation. To do that, right click on the Field Sensors item in the Observables section of the Navigation Tree and select Insert New Observable.... The Field Sensor Dialog opens up. At the top of the dialog and in the section titled Sensor Plane Location, first you need to set the plane of field calculation. In the dropdown box labeled Direction, you have three options X, Y, and Z, representing the"normals" to the XY, YZ and ZX planes, respectively. The default direction is Z, i.e. XY plane parallel to the substrate layers. In the three boxes labeled Coordinates, you set the coordinates of the center of the plane. Then, you specify the Size of the plane in project units, and finally set the Number of Samples along the two sides of the sensor plane. The larger the number of samples, the smoother the near field map will appear.
In the section titled Output Settings, you can also select the field map type from two options: Confetti and Cone. The former produces an intensity plot for field amplitude and phase, while the latter generates a 3D vector plot. In the confetti case, you have an option to check the box labeled Data Interpolation, which creates a smooth and blended (digitally filtered) map. In the cone case, you can set the size of the vector cones that represent the field direction. At the end of a sweep simulation, multiple field map are produced and added to the Navigation Tree. You can animate these maps. However, during the sweep only one field type is stored, either the E-field or H-field. You can choose the field type for multiple plots using the radio buttons in the section titled Field Display - Multiple Plots. The default choice is the E-field.
Once you close the Field Sensor dialog, its name is added under the Field Sensors node of the Navigation Tree. At the end of a SBR simulation, the field sensor nodes in the Navigation Tree become populated by the magnitude and phase plots of the three vectorial components of the electric (E) and magnetic (H) field as well as the total electric and magnetic fields defined in the following manner:
- [math] \mathbf{|E_{tot}|} = \sqrt{|E_x|^2 + |E_y|^2 + |E_z|^2} [/math]
- [math] \mathbf{|H_{tot}|} = \sqrt{|H_x|^2 + |H_y|^2 + |H_z|^2} [/math]
Computing Radiation Patterns In SBR
Coming Soon...
Scene Discretization & Adjustment
The Need For Discretization Of Propagation Scene
In a typical SBR simulation, a ray is traced from the location of the source until it hits a scatterer. The SBR method assumes that the ray hits either a flat facet of the scatterer or one of its edges. In the case of hitting a flat facet, the specular point is used to launch new reflected and transmitted rays. The surface of the facet is treated as an infinite dielectric medium interface, at which the reflection and transmission coefficients are calculated. In the case of hitting an edge, new diffracted rays are generated in the scene. However, only those who reach a nearby receiver in their line of sight are ever taken into account. In other words, diffractions are treated locally.
EM.Cube's Propagation Module allows you to draw any type of surface or solid CAD objects under impenetrable and penetrable surface groups. Some of these objects have flat faces such as boxes, pyramids, rectangle or triangle strips, etc. Some others contain curved surfaces or curved boundaries such as cylinders, cones, etc. All the non-flat surfaces have to be discretized in the form of a collection of smaller flat facets. EM.Cube uses a triangular surface mesh generator to discretize the penetrable and impenetrable surface objects of your propagation scene. This mesh generator is very similar to the ones used in EM.Cube's two other modules: MoM3D and Physical Optics (PO).
You can build a variety of surface and solid objects using EM.Cube's native "Curve" CAD objects like lines, polylines, circles, etc. You can use tools like Extrude, Loft, Strip-Sweep, Pipe-Sweep, etc. to transform curves into surface or solid objects. However, keep in mind that all the "Curve" CAD objects are ignored by the SBR mesh generator and are therefore not sent to the simulation engine.
Viewing SBR Mesh
You can view and examine the discretized version of your scene objects as they are sent to the SBR simulation engine. To view the mesh, click the Mesh ![]() button of the Simulate Toolbar or select Simulate > Discretization > Show Mesh, or use the keyboard shortcut Ctrl+M. A triangular surface mesh of your physical structure appears in the project workspace. In this case, EM.Cube enters it mesh view mode. You can perform view operations like rotate view, pan, zoom, etc. But you cannot select objects, or move them or edit their properties. To get out of the Mesh View and return to EM.Cube's Normal View, press the Esc Key of the keyboard, or click the Mesh button of the Simulate Toolbar once again, or go to the Simulate Menu and deselect the Discretization > Show Mesh item.
button of the Simulate Toolbar or select Simulate > Discretization > Show Mesh, or use the keyboard shortcut Ctrl+M. A triangular surface mesh of your physical structure appears in the project workspace. In this case, EM.Cube enters it mesh view mode. You can perform view operations like rotate view, pan, zoom, etc. But you cannot select objects, or move them or edit their properties. To get out of the Mesh View and return to EM.Cube's Normal View, press the Esc Key of the keyboard, or click the Mesh button of the Simulate Toolbar once again, or go to the Simulate Menu and deselect the Discretization > Show Mesh item.
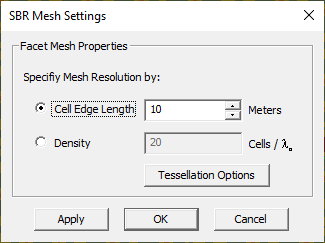
You can adjust the mesh resolution and increase the geometric fidelity of discretization by creating more and finer triangular facets. On the other hand, you may want to reduce the mesh complexity and send to the SBR engine only a few coarse facets to model your buildings. To adjust the mesh resolution, open the Mesh Settings Dialog by clicking the Mesh Settings ![]() button of the Simulate Toolbar or select Simulate > Discretization > Mesh Settings.... This dialog provides a single parameters: Edge Length., which has a default value of 100 project units. If you are already in the Mesh View Mode and open the Mesh Settings Dialog, you can see the effect of changing the edge length using the Apply button. Click OK to close the dialog.
button of the Simulate Toolbar or select Simulate > Discretization > Mesh Settings.... This dialog provides a single parameters: Edge Length., which has a default value of 100 project units. If you are already in the Mesh View Mode and open the Mesh Settings Dialog, you can see the effect of changing the edge length using the Apply button. Click OK to close the dialog.
Note that unlike EM.Cube's other computational modules that express the default mesh density based on the wavelength, the resolution of the SBR mesh generator is expressed in project length units. The default edge length value of 100 units might be too large for non-flat objects. You may have to use a lower value to capture the curvature of your curved structures adequately.
Figure 1: Propagation Module's Mesh Settings dialog.
Special Discretized Object Types
In EM.Cube, terrain objects are represented by and saved as special "Tessellated" objects with quadrilateral cells. This is true of terrain objects that you create yourself using EM.Cube's Terrain Generator as well as all the terrain objects that you import from external files to your project. The center of each cell represents the terrain elevation at that point. Tessellated objects are considered as discretized objects by EM.Cube and they are not meshed one more time by the SBR mesh generator. Each quadrilateral cell is divided into two triangular cells before being passed to the SBR simulation engine. Therefore, when using EM.Cube's Terrain Generator to create a new terrain object, you have to pay special attention to the resolution of the terrain object as it determines the total number of terrain facets sent to the simulation engine. A high resolution terrain, although looking better and more realistic, may easily lead to an enormous computational problem.
You can use EM.Cube's "Polymesh" tool to discretize solid and surface CAD objects. You can manually control the mesh characteristics of polymesh objects including inserting new nodes on faces and edges or deleting existing nodes. In addition, EM.Cube's Solid Generator and Surface Generator tools create ploymesh solids and surfaces, respectively. Like tessellated object, polymesh objects are also considered as discretized objects by EM.Cube and they are not meshed again by the SBR mesh generator.
SBR Mesh Rules & Considerations
Coming Soon...
Adjusting Block Elevation On Terrain
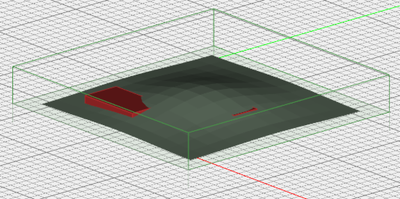
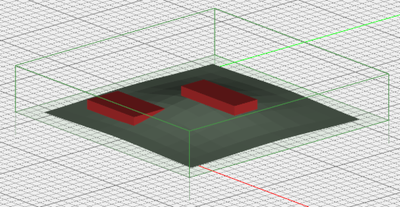
In EM.Cube, buildings and all other CAD objects are initially created on the XY plane by default. In other words, the Z-coordinate of the local coordinate system (LCS) of all blocks is set to zero until you change them. As long as you use the global ground, all is fine as your buildings are seated on the ground. When your propagation scene has an irregular terrain, you want to place your buildings on the terrain and not buried under it. Buildings in EM.Cube are not adjusted to the terrain elevation automatically. You need to instruct EM.Cube to do so.
To update the building positions and adjust their elevation to the underlying terrain, right click on the Terrain item of the Navigation Tree and select Adjust Scene Elevation from the context menu. All the blocks in the scene are automatically elevated in the Z direction such that their bases sit on the terrain. In effect, all the blocks are translated along the global Z axis by proper amounts such that their local Z coordinate equals the Z-elevation of the underlying terrain object. This feature is particularly useful if you change the location of the terrain or import a new terrain after the blocks have been created.
Note: You have to make sure that the resolution of your terrain, its fluctuation scale and building dimensions are all comparable. Otherwise, on a high-resolution, rapidly varying terrain, you will have buildings whose bottoms are in contact with the terrain only at a few points and parts of them hang in the air.
Figure: A Scene with Buildings and Terrain Before and After Adjusting Elevation
Transmitters & Receivers Above An Irregular Terrain
In EM.Cube, all the transmitters and receivers are tied up with point objects in the project workspace. These point objects are grouped and organized in base sets. When you move the point objects or change their coordinates, all of their associated transmitters or receivers immediately follow them to the new location. For example, you usually define a grid of receivers using a base set that is made up of a uniformly spaced array of points and spread them in your scene. All of these receivers have the same height because their associated base points all have the same Z-coordinate. When your receivers are located above a flat terrain like the global ground, their Z-coordinates are equal to their height above the ground, as the terrain elevation is fixed and equal to zero everywhere. The same is true for transmitters, too.
In many propagation modeling problems, your transmitters and receivers may be located above an irregular terrain with varying elevation across the scene. In that case, you may want to place your transmitters or receivers at a certain height above the underlying ground. The Z-coordinate of a transmitter or receiver is now the sum of the terrain elevation at the base point and the specified height. EM.Cube gives you the option to adjust the transmitter and receiver sets to the terrain elevation. This is done for individual transmitter sets and individual receiver sets. At the top of the Transmitter Dialog there is a check box labeled "Adjust Tx Sets to Terrain Elevation". Similarly, at the top of the Receiver Dialog there is a check box labeled "Adjust Rx Sets to Terrain Elevation". These boxes are unchecked by default. As a result, your transmitter sets or receiver sets coincide with their associated base points in the project workspace. If you check these boxes and place a transmitter set or a receiver set above an irregular terrain, the transmitters or receivers are elevated from the location of their associated base points by the amount of terrain elevation as can be seen in the figure below.
To better understand why there are two separate sets of points in the scene, note that a point array (CAD object) is used to create a uniformly spaced base set. The array object always preserves its grid topology as you move it around the scene. However, the transmitters or receivers associated with this point array object are elevated above the irregular terrain and no longer follow a strictly uniform grid. If you move the base set from its original position to a new location, the base points' topology will stay intact, while the associated transmitters or receivers will be redistributed above the terrain based on their new elevations.
Figure: Transmitters and receivers adjusted above an uneven terrain and their associated base sets.
Running A SBR Simulation
EM.Cube's Propagation Module offers three types of ray tracing simulations:
- Analysis
- Frequency Sweep
- Parametric Sweep
An SBR analysis is the simplest ray tracing simulation and involves the following steps:
- Set the unit of project scene and the frequency of operation. Note that EM.Cube's default project unit is millimeter. When working with the Propagation Module, pay attention to the project unit. Radio propagation problems usually require meter, mile or kilometer as the project unit.
- Create the blocks and draw the buildings at the desired locations.
- Keep the default ray domain and accept the default global ground or change its material properties.
- Define the base sets (at least one for the transmitter and one for the receiver).
- Define the transmitter and receiver(s) using the available base sets.
- Run the SBR simulation engine.
- Visualize the coverage map and plot other data.
You can access the Propagation Module's run dialog by clicking the Run ![]() button of the Simulate Toolbar or by selecting Simulate > Run... or using the keyboard shortcut Ctrl+R. When you click the Run button, a new window opens up that reports the different stages of the SBR simulation and indicates the progress of each stage. After the SBR simulation is successfully completed, a message pops up and prompts the completion of the process.
button of the Simulate Toolbar or by selecting Simulate > Run... or using the keyboard shortcut Ctrl+R. When you click the Run button, a new window opens up that reports the different stages of the SBR simulation and indicates the progress of each stage. After the SBR simulation is successfully completed, a message pops up and prompts the completion of the process.
Figure 1: Propagation Module's Simulation Run dialog.
SBR Simulation Parameters
There are a number of SBR simulation settings that can be accessed and changed from the SBR Settings Dialog. To open this dialog, click the button labeled Settings on the right side of the Select Engine dropdown list in the Run Dialog. EM.Cube's SBR simulation engine allows you to separate the physical effects that are calculated during a ray tracing process. You can selectively enable or disable Ray Reflection, Ray Transmission and Ray Diffraction. By default, all three effects are checked and included in the computations. Separating these effects sometimes help you better analyze your propagation scene and understand the impact of various blocks in the scene.
EM.Cube requires a finite number of ray bounces for each original ray emanating from a transmitter. This is very important in situations that may involve resonance effects where rays get trapped among certain group of surfaces and may bounce back and forth indefinitely. This is set using the box labeled "Max No. Ray Bounces", which has a default value of 10. Note that the maximum number of ray bounces directly affects the computation time as well as the size of output simulation data files. This can become critical for indoor propagation scenes, where most of the rays undergo a large number of reflections.
As rays travel in the scene and bounce from surfaces, they lose their power and their amplitudes diminish. From a practical point of view, only rays that have power above the receiver sensitivity threshold can be effectively received. Therefore, all the rays whose power fall below a specified power threshold are discarded. The Ray Power Threshold is specified in dBm and has a default value of -100dBm. Keep in mind that the value of this threshold directly affects the accuracy of the simulation results as well as the size of the output data file.
You can also set the Angular Resolution of the transmitter rays in degrees. By default, every transmitter emanates equi-angular ray tubes at a resolution of 1 degree. Lower angular resolutions larger than 1° speed up the SBR simulation significantly, but they may compromise the accuracy. Higher angular resolutions less than 1° increase the accuracy of the simulating results, but they also increase the computation time.
Figure 1: Propagation Module's SBR Engine Settings dialog.
The Coverage Map
If the associated radiator set is isotropic, so will be the transmitter set. By default, an isotropic transmitter has vertical polarization. You can use the Polarization radio button to select one of the two options: Vertical or Horizontal. If the associated radiator set consists of Short Dipole or User Defined radiators, it is indicated in the transmitter property dialog. In the case of a short dipole radiator, you can set a value for the dipole current in Amperes. The radiation resistance of a short dipole of length dl is given by:
- [math] R_r = 80\pi^2 \left( \frac{dl}{\lambda_0} \right)^2 [/math]
The radiated power of a short dipole carrying a current I0 is then given by:
- [math] P_{rad} = \frac{1}{2} R_r |I_0|^2 = 40\pi^2 |I_0|^2 \left( \frac{dl}{\lambda_0} \right)^2 [/math]
For isotropic and user defined radiators you can set the Input Power and Phase of a transmitter set in Watts and degrees, respectively. This can be accessed from the Transmitter Chain dialog, which will be described in detail in the next section. The radiation pattern of the associated radiator set is normalized and used in conjunction with the input power value to create a weighted distribution of transmitted rays. In certain cases like hybrid simulations, you may want to use the actual values of the far field to define the transmitter power rather than a normalized radiation pattern. Note that the pattern (.RAD) file contains the value of total radiated power in its header. In this case, check the box labeled "Calculate Power From Radiation Pattern". This is calculated directly from the complex θ and φ components of the far field data by integrating them over the entire space (4π solid angle). Note that this option is available only when the radiator is of the User Defined type. When this box is checked, the transmitter chain button is grayed out. By default, an isotropic transmitter emanates rays uniformly in all directions at the angular resolution specified by the user. A transmitter with a user defined associated radiator may represent a highly directional radiation pattern with the main beam pointing in a certain direction. You can additionally force and limit the Angular Extents of rays to a certain solid angle around the transmitter. This is especially useful and computationally efficient when the transmitter is on one side of the scene, and all the scatterers and receivers are on the other side. In this case, there is no need to generate rays in all directions. To limit the angular extents of rays, define the Start and End values for both Theta (θ) and Phi (φ) angles. The value of the angular resolution of the rays can be changed from the Run Dialog as will be discussed later.
In a regular SBR simulation, you have a transmitter and one or more arrays of receivers in your scene. At the end of the simulation, you can visualize the coverage map of the transmitter over the receiver sets. A coverage map shows the total Received Power by each of the receivers and is visualized as a color-coded intensity plot. You can visualize the coverage maps of individual receiver sets. At the end of a SBR simulation, each Received Power Coverage Map is listed under the receiver set's name in the Navigation Tree. To display a coverage map, simply click on its entry in the Navigation Tree. The coverage map plot appears in the Main Window overlaid on the scene. A legend box on the right shows the color scale and units (dB). The 3-D coverage maps are displayed as horizontal confetti above the receivers. If the receivers are packed close to each other, you will see a continuous confetti map. If the receivers are far apart, you will see individual colored squares. You can also visualize coverage maps as colored 3-D cubes. This may be useful when you set up your receivers in a vertical arrangement or the scene has a highly uneven terrain. To change the type of coverage map visualization, open the receiver set's property dialog and select the desired option for Coverage Map: Confetti or Cube in the "Visualization Options" section of the dialog.
Figure: Received power coverage map: (Left) confetti style, and (Right) cube style.
You can change the settings of the coverage map by right clicking on its entry in the Navigation Tree and selecting Properties... or by double-clicking on the legend box. In the Output Plot Settings dialog, you can choose from one of three Color Map options: Default, Rainbow and Grayscale. The visualization plot uses default values for the color scale. In the section titled "Limits", you can choose the radio button labeled User Defined. Then, you have to enter new values for the Lower and Upper Limits of the plot. You can also show or hide the Legend Box or change its Background and Foreground colors by clicking the buttons provided for this purpose.
Output Plot Settings
The Ray Data
At the end of a SBR simulation, each receiver receives a number of rays. Some receivers may not receive any rays at all. You can visualize all the rays received by a certain receiver from the active transmitter of the scene. To do this, right click the Receivers item of the Navigation Tree. From the context menu select Show Received Rays. All the rays received by the currently selected receiver of the scene are displayed in the scene. The rays are identified by labels, are ordered by their power and have different colors for better visualization. You can display the rays for only one receiver at a time. The receiver set property dialog has a list of all the individual receivers belonging to that set. To display the rays received by another receiver, you have to change the Selected Receiver in the receiver set's property dialog. If you keep the mouse focus on this dropdown list and roll your mouse scroll wheel, you can scan the selected receivers and move the rays from one receiver to the next in the list. To remove the visualized rays from the scene, right click the Receivers item of the Navigation Tree again and from the context menu select Hide Received Rays.
Visualization of received rays at the location of the selected receiver.
You can also view the ray parameters by opening the property dialog of a receiver set. By default, the first receiver of the set is always selected. You can select any other receiver from the drop-down list labeled Selected Receiver. If you click the button labeled Show Ray Data, a new dialog opens up with a table that contains all the received rays at the selected receiver and their parameters:
- Delay is the total time delay that a ray experiences travelling from the transmitter to the receiver after all the reflections, transmissions and diffractions and is expressed in nanoseconds.
- Ray Field is the received electric field at the receiver location due to a specific ray and is given in dBV/m.
- Ray Power is the received power at the receiver due to a specific ray and is given in dBm.
- Angles of Arrival are the θ and φ angles of the incoming ray at the local spherical coordinate system of the receiver.
The Ray Data Dialog also shows the Total Received Power in dBm and Total Received Field in dBV/m due to all the rays received by the receiver. You can sort the rays based on their delay, field, power, etc. To do so, simply click on the grey column label in the table to sort the rays in ascending order based on the selected parameter. You can also select any ray by clicking on its ID and highlighting its row in the table. In that case, the selected rays is highlighted in the Project Workspace and all the other rays become thin (faded).
Note: The rays are summed up coherently at the receiver.
Figure: Analyzing a selected ray from the ray data dialog.
Plotting Other Simulation Results
Besides visualizing the coverage map and received rays in the EM.CUBE's Propagation Module, you can also plot the Path Loss of all the receivers belonging to a receiver set as well as the Power Delay Profile of individual receivers. To plot these data, go the Observables section of the Navigation Tree and right click on the Receivers item. From the context menu, select Plot Path Loss or Plot Power Delay Profile, respectively. The path loss data between the active transmitter and all the receivers belonging to a receiver set are plotted on a Cartesian graph. The horizontal axis of this graph represents the index of the receiver. Power Delay Profile is a bar chart that plots the power of individual rays received by the currently selected receiver versus their time delay. If there is a line of sight (LOS) between a transmitter and receiver, the LOS ray will have the smallest delay and therefore will appear first in the bar chart. Sometimes you may have several rays arriving at a receiver at the same time, i.e. all with the same delay, but with different power level. These will appear as stacked bars in the chart.
You can also plot the path loss and power delay profile graphs and many others from EM.CUBE's data manager. You can open data manager by clicking the Data Manager ![]() button of the Compute Toolbar or by selecting Compute
button of the Compute Toolbar or by selecting Compute ![]() Data Manager from the menu bar or by right clicking on the Data Manager item of the Navigation Tree and selecting Open Data Manager... from the contextual menu or by using the keyboard shortcut Ctrl+D. In the Data manager Dialog, you will see a list of all the data files available for plotting. These include the theta and phi angles of arrival and departure of the selected receiver. You can select any data file by clicking and highlighting its ID in the table and then clicking the Plot button.
Data Manager from the menu bar or by right clicking on the Data Manager item of the Navigation Tree and selecting Open Data Manager... from the contextual menu or by using the keyboard shortcut Ctrl+D. In the Data manager Dialog, you will see a list of all the data files available for plotting. These include the theta and phi angles of arrival and departure of the selected receiver. You can select any data file by clicking and highlighting its ID in the table and then clicking the Plot button.
Output Data Files
At the end of an SBR simulation, the results are written into a main output data file with the reserved name of SBR_Results.RTOUT. This file has the following format:
NEW LINE:
- Receiver Number
- Receiver Base X, Y , Z Coordinates
- Receiver Height
NEW LINE:
Number of Rays
NEW LINE:
- Ray Number
- θ and φ Angles of Arrival in deg
- θ and φ Angles of Departure in deg
- Delay in nsec
- Real(EV) & Imag(EV)
- Real(EH) & Imag(EH)
- Real(E.eR) & Imag(E.eR)
- Power
The angles of arrival are the θ and φ angles of a received ray measured in degrees and are referenced in the spherical coordinate systems centered at the location of the receiver. The angles of departure for a received ray are the θ and φ angles of the originating transmitter ray, measured in degrees and referenced in the spherical coordinate systems centered at the location of the active transmitter, which eventually arrives at the receiver. The total time delay is measured in nanoseconds between t = 0 nsec at the time of launch from the transmitter location till being received at the receiver location. The last four columns show the real and imaginary parts of the received electric fields with vertical and horizontal polarizations, respectively. The complex field values are normalized in a way that when their magnitude is squared, it equals the received ray power. If the active transmitter is an isotropic radiator with either a vertical or horizontal polarization, then the field components corresponding to the other polarization will have zero entries in the output data file.
Figure: A typical SBR output data file.
Running A Frequency Sweep With SBR
By default, you run a single-frequency simulation in EM.CUBE's Propagation Module. You set the operational frequency of a SBR simulation in the project's Frequency Dialog, which can be accessed in a number of ways:
- By clicking the Frequency
 button of the Compute Toolbar.
- By selecting Compute
 Frequency Settings... from the Menu Bar.
- Using the keyboard shortcut Ctrl+F.
- By double clicking the frequency section (box) of the Status Bar.
(Left) Project's frequency dialog and (Right) the frequency settings dialog.
You can also select the Frequency Sweep option in the Simulation Mode drop-down list of the Run Dialog. Click the Settings... button on the right side of this dropdown list to open up the Frequency Settings Dialog. Based on the original values of the project center frequency and bandwidth, the Start Frequency and End Frequency have default values. You can also change the Number of Samples. Once you click the Run button, EM.CUBE performs a frequency sweep by assigning each of the frequency samples as the current operational frequency and running the SBR simulation engine at that frequency. All the simulation data at all frequency samples are saved into the output data files including "SBR_results.RTOUT". After the completion of a frequency sweep simulation, as many coverage maps as the number of frequency samples are generated and added to the Navigation Tree under the Receiver Set's entry. You can click on each of the coverage maps corresponding to each of the frequency samples and visualize it in the project workspace. You can also animate the coverage maps. To do so, right click on the receiver set's name in the Navigation Tree and select Animation from the contextual menu. The coverage maps start to animate by their order on the Navigation Tree. Once the entire list is displayed sequentially, it starts all over again from the beginning of the list. During the animation, the Animation Controls dialog appears at the lower right corner of the screen. This dialog has a number of buttons for pause/resume, step forward/backward, and step to the end/start. The title of each coverage map is shown in the box labeled Sample as it is displayed in the main window. You can also change the speed of animation. The default frame duration has a value of 300 (3x100) milliseconds. To stop the animation, simply press the keyboard's Esc Key.
Multiple coverage maps on the Navigation Tree at the end of a frequency sweep and starting an animation from the contextual menu.
Animation controls dialog in the project workspace.
Running a Parametric Sweep with SBR
In EM.CUBE, all the CAD object properties as well as certain source, material and mesh parameters can be assigned as variables. Variables are defined to control and vary the values of such parameters either for editing purposes or to run parametric sweep or optimization. Variable are defined using the Variables Dialog, which can be accessed in the three ways:
- By clicking the Variables
 button of the Compute Toolbar.
- By selecting Compute
 Variables... from the Menu Bar.
- Using the keyboard shortcut Ctrl+B.
The variables dialog is initially empty. To add a new variable, click the Add button to open up the Add Variable/Syntax Dialog. In this dialog you have to type in a name for the new variable and choose a type. The default type is Uniformly Spaced Samples. You also need to specify the Start, Stop and Step values for the variable. In the figure below, a variable called "Tx_Height" is defined that varies between 2 and 10 with equal steps of 2. This means the sample set {2,4,6,8,10}. When you return to the variables dialog, the syntax of the new variable is shown as 2:10:2. The last number in this syntax is always the variable step. In this example, this variable is going to be used to control the height of the transmitter in a propagation scene.
Next, you have to attach the variable to the CAD object. In this case, the CAD object is the point object that represents the transmitter's radiator. To attach a variable to a CAD object, open the object's property dialog and type in the name of the variable as the value of a property or parameter. In this case, the variable Tx_Height is going to control the Z-Coordinate of the point object. Once the value of the object parameter is replaced by the name of an already defined variable, it is updated with the current value of that variable. In the case of a variable of "Uniformly Spaced Samples" type, the current value is the start value. This value will be incrementally varied during a parametric sweep simulation process. Note that a variable can take a fixed value or a discrete set of values, too. You can always open the variables dialog and change the value or syntax of any variable. To make a new or modified value effective, click the Apply button of the variables dialog. You can test the values by performing a Dry Run of the selected variable. This runs an animation of the project workspace as the value of the variable changes and all the related CAD objects are updated accordingly. Note that you can attach the same variable to more than one CAD object property or to the properties of different objects. You can also define multiple values or syntaxes to the same variable. To do so, open the Add Variable/Syntax Dialog, and instead of typing in a new variable name, choose an existing variable name from the Name dropdown list. This will add a new value or syntax to the existing syntax(es) of the selected variable. When you return to the variables dialog, variables with more than one value or syntax will have a dropdown list in the Syntax column. You can choose any of these values or syntaxed at any time and make the change effective by clicking the Apply button.
Replacing the value of a CAD object parameter with a variable name.
To run a parametric sweep, open the Run Dialog and select the Parametric Sweep option in the Simulation Mode drop-down list. If you have not defined any variables in the project, the box in the Variables row before the View will be red. You have to turn it into green before you can run a simulation. By clicking the View button, you can open up the variables dialog from here. Once you click the Run button, EM.CUBE performs a parametric sweep by incrementally varying the values of all the defined variables from their start to stop values at the specified steps and updating all the related CAD objects. After the completion of a parametric sweep simulation, as many coverage maps as the total number of variable samples are generated and added to the Navigation Tree under the receiver set's entry. You can click on each of the coverage maps and visualize it in the project workspace. You can also animate the coverage maps sequentially. To do so, right click on the receiver set's name in the Navigation Tree and select Animation from the contextual menu. To stop the animation, simply press the keyboard's Esc Key.
Choosing parametric sweep as the simulation mode in the run dialog. Note that one variable has been defined and EM.CUBE is ready to run the simulation.
The coverage map of the scene at the end of a parametric sweep where the sweep variable is the transmitter height.
Statistical Analysis of Propagation Scene
EM.CUBE's coverage maps display the received power at the location of all the receivers. The receivers together from a set/ensemble, which might be uniformly spaced or distributed across the propagation scene or may consist of randomly scattered radiators. Every coverage map shows the Mean and Standard Deviation of the received power for all the receivers involved. These information are displayed at the bottom of the coverage map's legend box and are expressed in dB.
In the Propagation Module, when you ran a sweep simulation (frequency, transmitter or parametric), you also have the option to generate two additional coverage maps: one for the mean of all the individual sample coverage maps and another for their standard deviation. To do so, in the Run Dialog, check the box labeled "Create Mean and Standard Deviation Coverage Maps". Note that the mean and standard deviation values displayed on the individual coverage maps correspond to the spatial statistics of the receivers in the scene, while the mean and standard deviation coverage maps correspond to frequency, transmitter or variable sets defined for the sweep simulation. Also, note that both of the mean and standard deviation coverage maps have their own spatial mean and standard deviation values expressed in dB at the bottom of their legend box.
The mean coverage map at the end of a transmitter sweep.
The standard deviation coverage map at the end of a transmitter sweep.

