Visualizing Simulation Data Using Graphs and Tables
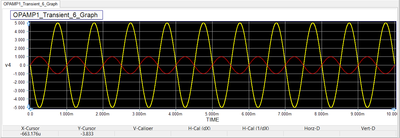
When you run a "Live Simulation" in B2.Spice A/D, the simulation results are typically displayed in real time using either virtual instruments or circuit animation on your schematic. At the end of B2.Spice A/D Tests, the simulation results are normally displayed using graphs, tables or both. B2.Spice A/D has a powerful "Data Manager" that can generate a variety of graphs types and tables for visualizing and displaying your test results. Some virtual instruments allow you to record the simulation data during a live simulation and then plot them on a graph, too.
At the end of an analog or mixed-mode circuit simulations, the node voltages, branch currents and device powers are typically available for graphing or tabulation. Voltages, current and powers are usually plotted as a function of time or frequency. In the case of a Network Analysis test, port characteristics like scattering, impedance or admittance parameters are also computed. At the end of a digital circuit simulation, it is the state of the digital inputs and outputs that you would like to visualize.
Setting Up Circuit Observables
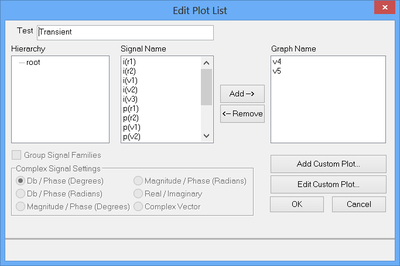
Even though all the circuit voltages currents are computed during a simulation, they are not automatically plotted for the obvious reason of avoiding congested and confusing graphs or enormous data tables. Therefore, you have to specify which circuit observables you would like to display at the end of a simulation.


