Difference between revisions of "Visualizing Simulation Data Using Graphs and Tables"
Kazem Sabet (Talk | contribs) |
Kazem Sabet (Talk | contribs) |
||
| Line 10: | Line 10: | ||
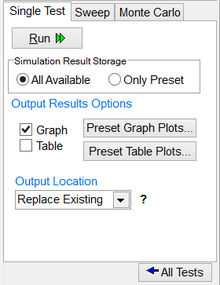
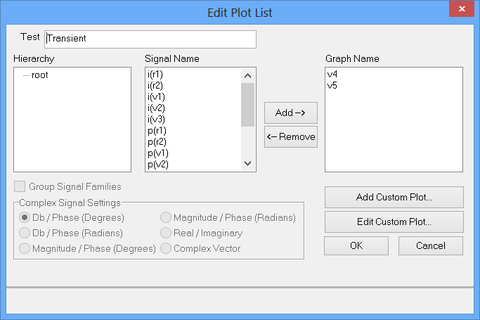
Even though all the circuit voltages currents are computed during a simulation, they are not automatically plotted for the obvious reason of avoiding congested and confusing graphs or enormous data tables. Therefore, you have to specify which circuit observables you would like to display at the end of a simulation. At the bottom of each Test Panel, there is a section dedicated to the specification of output results. Two checkboxes labeled "Graph" and "Table" and two buttons labeled "Preset Graph Plots" and "Preset Table Plots" are used to define all the observables to be graphed or tabulated. Both buttons open up the "Edit Plot List" dialog. You can either graph the output data or display them in tables or have it both ways. Note that the graph and table specifications are independent of each other and must be done separately. | Even though all the circuit voltages currents are computed during a simulation, they are not automatically plotted for the obvious reason of avoiding congested and confusing graphs or enormous data tables. Therefore, you have to specify which circuit observables you would like to display at the end of a simulation. At the bottom of each Test Panel, there is a section dedicated to the specification of output results. Two checkboxes labeled "Graph" and "Table" and two buttons labeled "Preset Graph Plots" and "Preset Table Plots" are used to define all the observables to be graphed or tabulated. Both buttons open up the "Edit Plot List" dialog. You can either graph the output data or display them in tables or have it both ways. Note that the graph and table specifications are independent of each other and must be done separately. | ||
| − | The Edit Plot List dialog consists of three tables. The table on the left shows the hierarchy for the case of multilevel signals. In the middle table you see a list of the available signals for plotting. The table on the right lists the signals to be plotted. Select one of more signals from the middle table and use the right arrow button (-->) to move them to the right table. You select more than one signal using the "Ctrl" key or a range of signals using the "Shift" key. You can also modify and revise the list of the signals to be plotted by moving | + | The Edit Plot List dialog consists of three tables. The table on the left shows the hierarchy for the case of multilevel signals. In the middle table you see a list of the available signals for plotting. The table on the right lists the signals to be plotted. Select one of more signals from the middle table and use the right arrow button (-->) to move them to the right table. You select more than one signal using the "Ctrl" key or a range of signals using the "Shift" key. You can also modify and revise the list of the signals to be plotted by moving one or more items from the right table back to the middle table using the left arrow button (<--). |
Revision as of 20:55, 10 July 2014
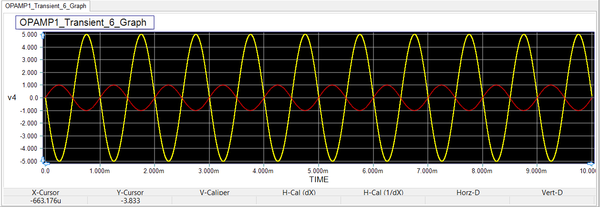
When you run a "Live Simulation" in B2.Spice A/D, the simulation results are typically displayed in real time using either virtual instruments or circuit animation on your schematic. At the end of B2.Spice A/D Tests, the simulation results are normally displayed using graphs, tables or both. B2.Spice A/D has a powerful "Data Manager" that can generate a variety of graphs types and tables for visualizing and displaying your test results. Some virtual instruments allow you to record the simulation data during a live simulation and then plot them on a graph, too.
At the end of an analog or mixed-mode circuit simulations, the node voltages, branch currents and device powers are typically available for graphing or tabulation. Voltages, current and powers are usually plotted as a function of time or frequency. In the case of a Network Analysis test, port characteristics like scattering, impedance or admittance parameters are also computed. At the end of a digital circuit simulation, it is the state of the digital inputs and outputs that you would like to visualize.
Setting Up Circuit Observables
Even though all the circuit voltages currents are computed during a simulation, they are not automatically plotted for the obvious reason of avoiding congested and confusing graphs or enormous data tables. Therefore, you have to specify which circuit observables you would like to display at the end of a simulation. At the bottom of each Test Panel, there is a section dedicated to the specification of output results. Two checkboxes labeled "Graph" and "Table" and two buttons labeled "Preset Graph Plots" and "Preset Table Plots" are used to define all the observables to be graphed or tabulated. Both buttons open up the "Edit Plot List" dialog. You can either graph the output data or display them in tables or have it both ways. Note that the graph and table specifications are independent of each other and must be done separately.
The Edit Plot List dialog consists of three tables. The table on the left shows the hierarchy for the case of multilevel signals. In the middle table you see a list of the available signals for plotting. The table on the right lists the signals to be plotted. Select one of more signals from the middle table and use the right arrow button (-->) to move them to the right table. You select more than one signal using the "Ctrl" key or a range of signals using the "Shift" key. You can also modify and revise the list of the signals to be plotted by moving one or more items from the right table back to the middle table using the left arrow button (<--).


