EM.Tempo Tutorial Lesson 4: Modeling A Patch Antenna Array
Contents
What You Will Learn
A patch antenna array is typically made up of Nx × Ny individual patch antennas (radiating elements) arranged on a rectangular grid with a uniform spacing of Sx and Sy along the X and Y directions, respectively. In EM.Tempo, you can model patch antenna arrays in a number of different ways:
- Analyze a single isolated patch antenna and use an array factor for radiation pattern calculation. But this method ignores all the inter-element coupling effects.
- Analyze an infinite periodic patch structure and use an array factor for radiation pattern calculation. This method accounts for the inter-element coupling effects, but it cannot capture edge and corner effects.
- Construct a finite-sized Nx × Ny patch array on a finite-sized substrate. This is a full-wave treatment of the antenna array structure but it may prove computationally very expensive.
In this tutorial you will try out the third method from the above list and model finite-sized probe-fed patch array structure.
![]() Back to EM.Tempo Tutorial Gateway
Back to EM.Tempo Tutorial Gateway
![]() Download projects related to this tutorial lesson
Download projects related to this tutorial lesson
Getting Started
Open the EM.Cube application and switch to EM.Tempo. Start a new project with the following attributes:
In this tutorial lesson, you will model a 4 × 4 array of probe-fed patch antennas. At an operating frequency of 1.575GHz, the free-space wavelength is about 190mm. Your patch array will have a uniform spacing of Sx = Sy = λ0/2 = 95mm in both X and Y directions.
Building a Finite-Sized Array
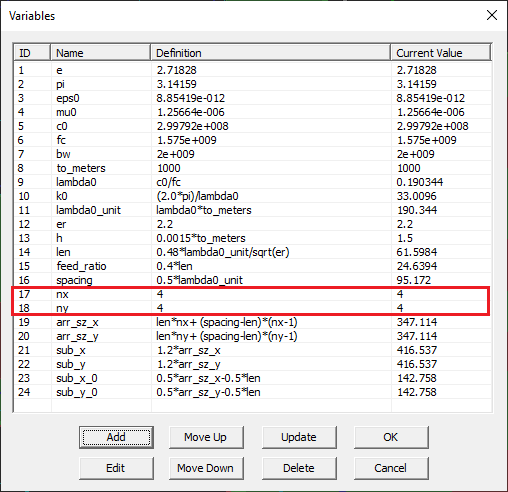
To build the finite-sized 4 × 4 patch array, use the Probe-Fed Patch Array Wizard ![]() button to create a default 2 × 2 patch array first. Then, open the variables dialog and change the values of the parameters "nx" and "ny" to 4.
button to create a default 2 × 2 patch array first. Then, open the variables dialog and change the values of the parameters "nx" and "ny" to 4.
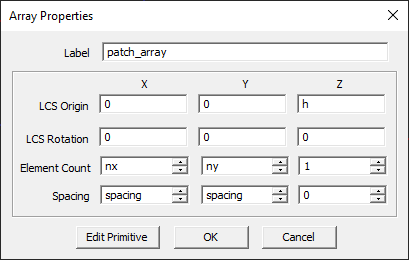
The patch array you just created is a rectangular grid configuration of the probe-fed patch antenna you analyzed at the beginning of the previous tutorial lesson. The wizard automatically generates an array object called "patch_array" out of a key element, which is a single probe-fed patch antenna in this case. The initial key object is called the "primitive" and becomes part of the newly created array object. You can change the array properties including its number of elements and element spacings along the three principal directions. You can also access the properties of the primitive and modify them as well. Once you change the primitive, all the other elements of the array object are automatically updated accordingly. Note that the inter-element spacing in both X and Y directions has been set equal to a variable called "spacing", defined to have a value of half the free-space wavelength.
Each patch element is excited using a probe feed. The feeds are located on an array of short vertical line objects called "feed_array". Just as you can place a lumped source on a line object (as you did in tutorial lessons 1 and 3), you can place an array of lumped sources on a line array subject to the same limitations. The wizard automatically created a lumped source array and associated it with "feed_array" as you can see from its property dialog:
The wizard also initiated a far-field radiation pattern observable with theta and phi angle increments both equal to 1°. Since the radiation pattern of antenna arrays usually involve multiple side lobes and nulls, a better resolution is needed than the default value of 5°. However, the wizard doesn't insert a port definition by itself. Note that in the case of your 4 × 4 patch array, this means a 16 × 16 scattering matrix. For this project, define a horizontal (Z-directed) field sensor plane and place it a Z = 1.5mm just like in the previous tutorial lesson.
Analyzing the Finite-Sized Patch Array Using the FDTD Solver
The mesh and solver settings for this project are less demanding than the previous lesson because you are not calculating the scattering parameters this time around. The mesh density is still 40 cells/λeff but some grid settings are more relaxed. Also, the default convergence criteria are accepted, that is a Power Threshold of -30dB and a Max No. Time Steps of 10,000. Run a wideband analysis of your finite-sized patch array. First, visualize the field distributions.
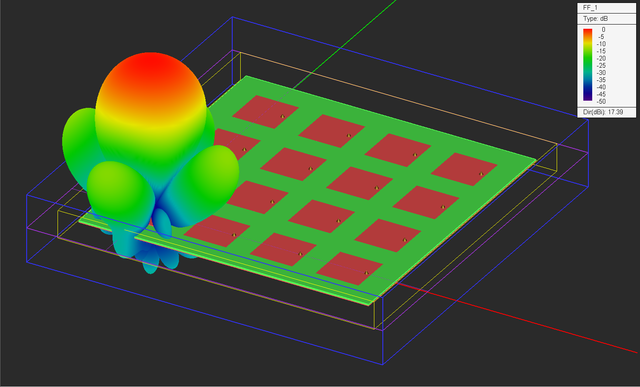
Next, visualize the 3D radiation pattern. The directivity of the 4 × 4 patch array is calculated to be D0 = 54.87.
Sometimes it is preferred to plot the radiation patterns on a dB scale. To do so, double-click on the legend to open up the Output Plot Settings dialog. You can also open this dialog from the contextual menu of the total 3D radiation pattern item in the navigation tree. In the Scale section of the dialog, select the "dB" radio button. The directivity is now displayed on the dB scale: D0 = 17.39dB.
Finally, graph the 2D Cartesian and polar radiation patterns of the patch array in the YZ plane.
Shaping the Beam of the Finite-Sized Array
In the previous part of this lesson, we assumed the all the 16 patch elements were excited using identical lumped sources. In other words, the amplitudes and phases of all the 16 lumped sources were assumed to be equal, hence, a uniform weight distribution. EM.Tempo allows you to define different weights for individual elements of a source array. Open the property dialog of the lumped source LS_1 and click the button labeled Array Weights.... In the array weight dialog, the Distribution drop-down list gives a number of options: Uniform, Binomial, Chebyshev and Custom. Uniform distribution is the default option as you used in the previous part of this tutorial lesson. Now select "Binomial" for a radiation pattern with minimal side lobes. Close the array weights dialog and then close the lumped source dialog to return to the project workspace.
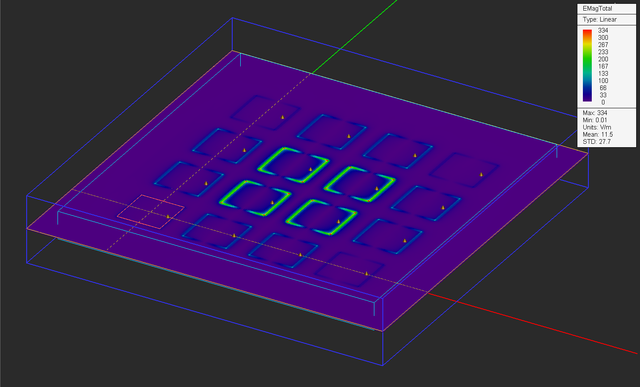
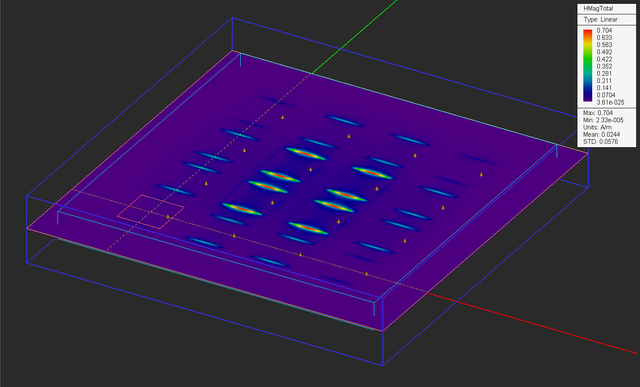
Run a new FDTD analysis of your finite-sized antenna array and visualize its near fields. As you would expect from a binomial distribution, the interior elements are hotter than the exterior elements.
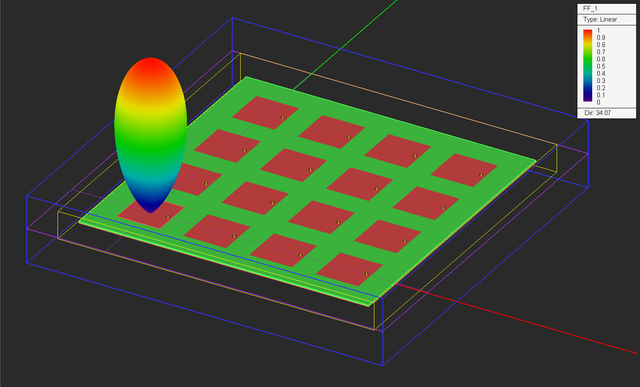
Next, visualize the 3D radiation pattern of the array. The directivity of the 4 × 4 patch array has now reduced to D0 = 34.07, but the side lobe has disappeared.
Steering the Beam of the Finite-Sized Array
In the last part of this tutorial lesson, you will steer the beam of your patch antenna array. In order to steer the beam of an antenna array to the spherical angles (θ, φ), a two-dimensional phase progression among the array elements is required along the X and Y directions given by the following equations:
[math]\Psi_x = -\frac{2\pi S_x}{\lambda_0} \sin\theta \cos\phi[/math]
[math]\Psi_y = -\frac{2\pi S_y}{\lambda_0} \sin\theta \sin\phi[/math]
where Sx and Sy are the element spacing along the X and Y directions, respectively. In this project, Sx = Sy = λ0/2. The phase progression is therefore given by:
[math]\Psi_x = - \pi \sin\theta \cos\phi[/math]
[math]\Psi_y = - \pi \sin\theta \sin\phi[/math]
In order to steer the array beam to θ = φ = +45°, you need phase progressions equal to Ψx = Ψy = -90° that is equal phase progression along both X and Y directions.
Run a new FDTD analysis of your beam-steered antenna array and visualize its 3D far-field radiation pattern. Note that the linear-scale directivity of the steered beam has reduced to D0 = 41.46.
The 2D radiation pattern data are generated in the three principal planes plus a fourth user-specified Phi-plane. The default fourth plane is set at φ = 45°. You can change the phi-plane cut from the radiation pattern dialog:
Open the Data Manager and plot both of the data files "FF_1_PATTERN_Cart_Custom" and "FF_1_PATTERN_Polar_Custom" data files.
Examining the Phase of the Radiating Elements
So far you have been mostly interested in the total field distribution maps. EM.Tempo also plots the phase distributions of all the three components of the electric and magnetic fields. The figure below shows the phase distribution of Ex on the patch array plane. This plot is called "EPhX" in the navigation tree. The phase progression among the patch elements is clearly visible from the plot.
