| Tutorial Project: Analyzing a Balanced BJT Mixer
|

|
|
Objective: In this project, you will build and analyze a balanced mixer circuit and examine its spectral performance.
|
|
Concepts/Features:
- Bipolar Junction Transistor
- Balanced Mixer
- Operating Point Analysis
- Transient Test
- Fourier Analysis
- Fundamental Frequency
- Spectral Contents
|
|
Minimum Version Required: All versions
|
|
' Download Link: Analog Lesson 15 Download Link: Analog Lesson 15
|
What You Will Learn
In this tutorial you will build and test a balanced mixer circuit using differential BJT pairs. You will perform Fourier analysis of your mixer circuit to examine the various spectral contents present at the IF output of the mixer.
Putting the Mixer Circuit Together
The following is a list of parts needed for this part of the tutorial lesson:
|
|
| Part Name
|
Part Type
|
Part Value
|
| VRF
|
Voltage Source
|
Waveform TBD
|
| VLO
|
Voltage Source
|
Waveform TBD
|
| VCC
|
Voltage Source
|
DC, 10
|
| VBIAS
|
Voltage Source
|
DC, -2
|
| IEE
|
Current Source
|
DC, 300u
|
| RC1 - RC2
|
Resistor
|
5k
|
| C1
|
Capacitor
|
100p
|
| L1
|
Inductor
|
100u
|
| K1 - K3
|
Ideal Transformer
|
n = 1
|
| Q1 - Q6
|
Generic NPN BJT
|
Defaults (beta = 100)
|
| RF, LO, IF
|
Voltage Probe Marker
|
N/A
|
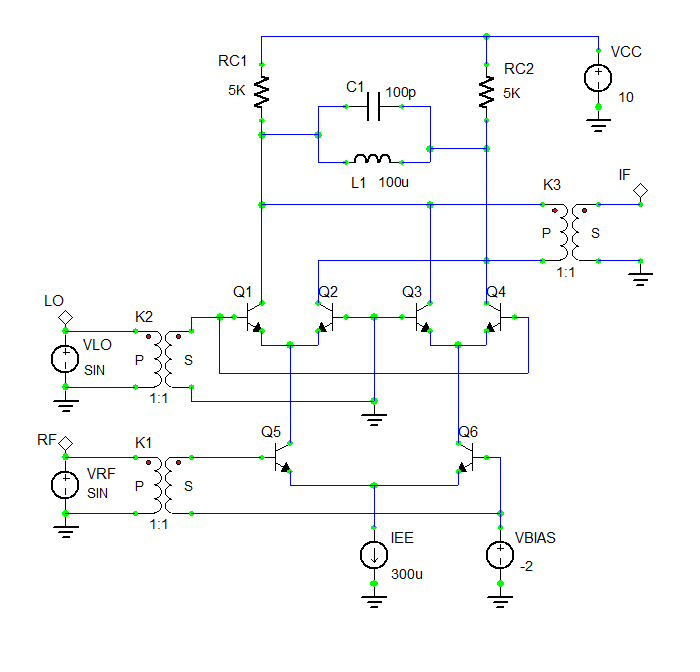
The figure below shows the balanced mixer:
 The schematic of the balanced BJT mixer. |
Set the waveforms of the two voltage sources VRF and VLO according to the following table:
|
|
VRF: Sinusoid
| Offset Voltage
|
0
|
| Peak Amplitude
|
2m
|
| Frequency
|
14.25Meg
|
| Delay Time
|
0
|
| Damping Factor
|
0
|
|
|
|
VLO: Sinusoid
| Offset Voltage
|
0
|
| Peak Amplitude
|
90m
|
| Frequency
|
12.75Meg
|
| Delay Time
|
0
|
| Damping Factor
|
0
|
Place all the parts in the Schematic Editor and connect them as shown above. The three 1:1 transformers K1, K2 and K3 at the two inputs (RF and LO) and at the output (IF) have been used as buffers for isolation. The output transformer K3 provides a convenient way to get the differential output at the collectors of Q1 and Q2.
Running an Operating Point Analysis
Run a DC Bias Test of your mixer circuit to verify the operating point performance of all the six BJT transistors. Make sure to check the Table checkbox in the Test Panel before running the test. Otherwise, no output data will be generated. The table below shows the test results:
 The tabulated results of DC bias test. |
Running a Transient Test of the Mixer Circuit
Run a Transient Test of this circuit with the parameters specified below:
|
|
| Start Time
|
0
|
| Stop Time
|
5u
|
| Linearize Step
|
1n
|
| Step Ceiling
|
1n
|
| Preset Graph Plots
|
v(rf), v(lo), v(if)
|
The results for the RF, LO and IF voltages are shown in the figure below:
 The graph of RF, LO and IF voltages in the mixer circuit. |
You can zoom to a selected plot to better examine its details. First, activate the graph window. Then, click the "Zoom to Selected Plot"  button of the Graph Toolbar and click on the IF plot to select it. You can see that frequency of the IF signal is fIF = fRF - fLO = 14.25MHz - 12.75MHz = 1.5MHz. button of the Graph Toolbar and click on the IF plot to select it. You can see that frequency of the IF signal is fIF = fRF - fLO = 14.25MHz - 12.75MHz = 1.5MHz.
 A close-up of the IF voltage plot. |
Performing a Spectral Analysis of the Mixer Circuit
In order to find out how pure the IF signal is, perform a Fourier analysis of the output voltage of your mixer circuit. As you did in the Analog Tutorial Lesson 13, this can be done from the Transient Test Panel. In the "Fourier Transform Settings dialog", set the positive node to 13 and the reference node to 0 (ground). Run six transient tests, each with a different fundamental frequency as listed below:
- fo = fIF = 1.5MHz
- fo = fRF = 14.25MHz
- fo = fLO = 12.75MHz
- fo = fRF + fLO = 27MHz
- fo = 2*fRF - fLO = 15.75MHz
- fo = 2*fLO - fRF = 11.25MHz
The six Fourier content bar charts are shown in the figures below. As you can see from these figures, there are no harmonics of the IF frequency present at the output. The spectral contents at the RF and LO as well as the sum and image frequencies are all about 10 times smaller than that of the IF frequency.
 The spectral contents of the IF voltage at the IF frequency f o = 1.5MHz and its harmonics. |
 The spectral contents of the IF voltage at the RF frequency f o = 14.25MHz and its harmonics. |
 The spectral contents of the IF voltage at the LO frequency f o = 12.75MHz and its harmonics. |
 The spectral contents of the IF voltage at the sum frequency f o = 27MHz and its harmonics. |
 The spectral contents of the IF voltage at the image frequency f o = 15.75MHz and its harmonics. |
 The spectral contents of the IF voltage at the image frequency f o = 11.25MHz and its harmonics. |
 Back to RF.Spice A/D Tutorial Gateway Back to RF.Spice A/D Tutorial Gateway
|
|


