EM.Ferma Tutorial Lesson 4: Computing The Magnetic Field Of Linear Currents In Free Space & Magnetic Media
Contents
- 1 What You Will Learn
- 2 Getting Started
- 3 Constructing the Geometry of a Current-Carrying Cylinder
- 4 Performing a Magnetostatic Analysis of Your Structure
- 5 Verifying Your Magnetostatic Simulation Results
- 6 Analyzing Two Parallel Line Currents
- 7 Adding a Magnetic Material Part to Your Structure
- 8 Testing a More Complicated Magnetic Material Part
What You Will Learn
This tutorial will guide you through all the necessary steps required to set up and perform a basic magnetostatic simulation and visualize and graph the simulation results. Specifically, you will create cylindrical current objects and analyze their magnetic field and potential. You will also introduce magnetic material objects with simple and complex geometrical shapes and see the effect of their presence on the magnetic fields.
![]() Back to EM.Ferma Tutorial Gateway
Back to EM.Ferma Tutorial Gateway
![]() Download projects related to this tutorial lesson
Download projects related to this tutorial lesson
Getting Started
Open the EM.Cube application and switch to EM.Ferma. Start a new project with the following parameters:
Constructing the Geometry of a Current-Carrying Cylinder
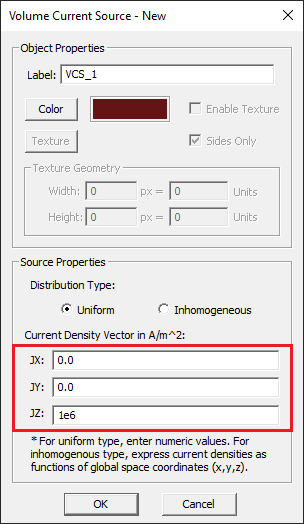
Create a volume current source group called "VCS_1" in the navigation tree. Right-click on the Volume Currents item in the navigation tree and select Insert New Current Source... from the contextual menu. In the New current source dialog, set the values of the components of the current density vector as follows:
| Component | Definition |
|---|---|
| Jx | 0 |
| Jy | 0 |
| Jz | 1e+6 |
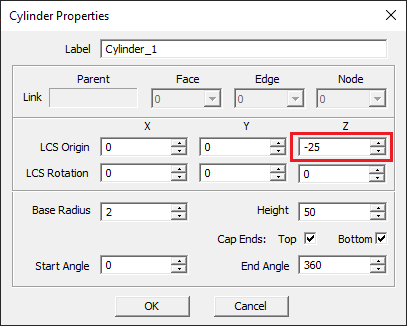
With the VCS_1 group active, click the Cylinder ![]() button of the Object Toolbar or select the menu item Object → Solid → Cylinder and draw an upright cylinder according to the table below:
button of the Object Toolbar or select the menu item Object → Solid → Cylinder and draw an upright cylinder according to the table below:
| Part | Object Type | Material Type | Dimensions | Coordinates | Rotation Angles |
|---|---|---|---|---|---|
| Cylinder_1 | Cylinder | VCS_1 | radius = 2mm, height = 50mm | (0, 0, -25mm) | (0°, 0°, 0°) |
Open the mesh settings dialog and change the fixed mesh cell size to Δx = Δy = Δz = 0.5mm. Define three field sensor observables according to the table below:
| Field Sensor | Direction | Coordinates | Plot Type | Max. Size | Cone Length Ratio | Cone Radius Ratio |
|---|---|---|---|---|---|---|
| Sensor_1 | Z | (0, 0, 0) | Vector | 0.5 | 0.75 | 0.25 |
| Sensor_2 | X | (0, 0, 0) | Vector | 2 | 0.25 | 0.25 |
| Sensor_3 | Y | (0, 0, 0) | Intensity | - | - | - |
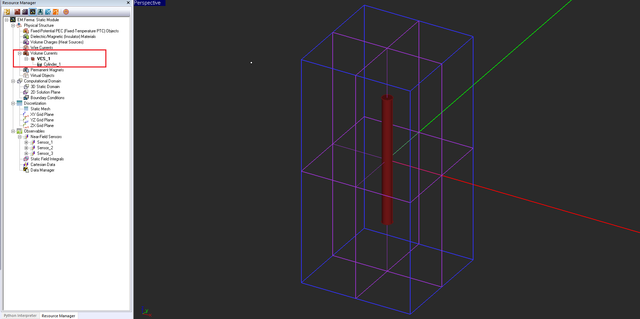
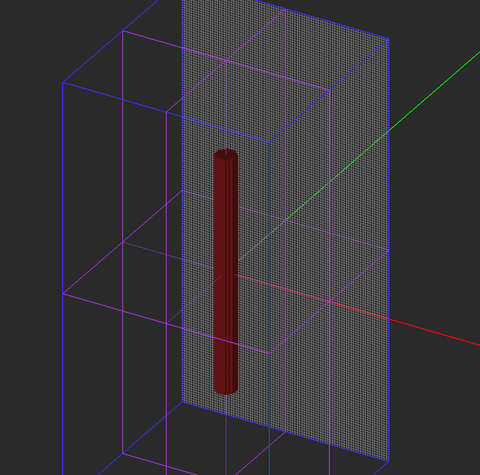
Your physical structure should now look like this:
The figure below shows the mesh of the cylindrical object:
Performing a Magnetostatic Analysis of Your Structure
At this time, your project is ready for magnetostatic simulation. You don't have to choose the simulation engine type of electrostatic vs. magnetostatic. If the program detects current sources, it will perform a magnetostatic analysis.
| |
EM.Ferma's simulation engine solves a linear system whose solution is the potential values at all the N grid points. An electrostatic linear system involves N unknowns corresponding to the electric scalar potential, while a magnetostatic linear system involves 3N unknowns corresponding to the magnetic vector potential. |
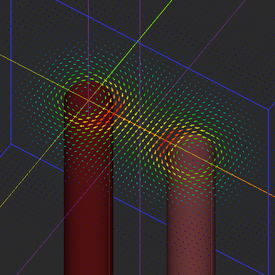
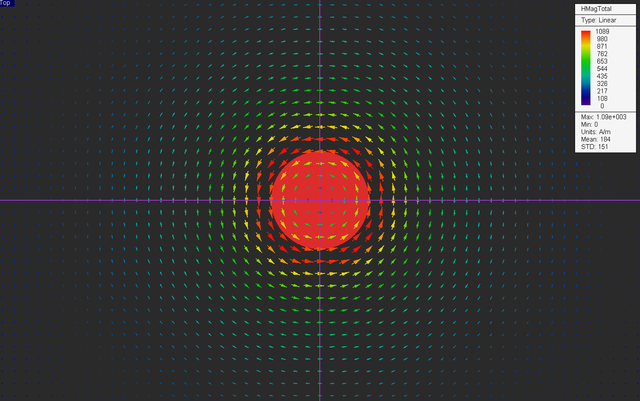
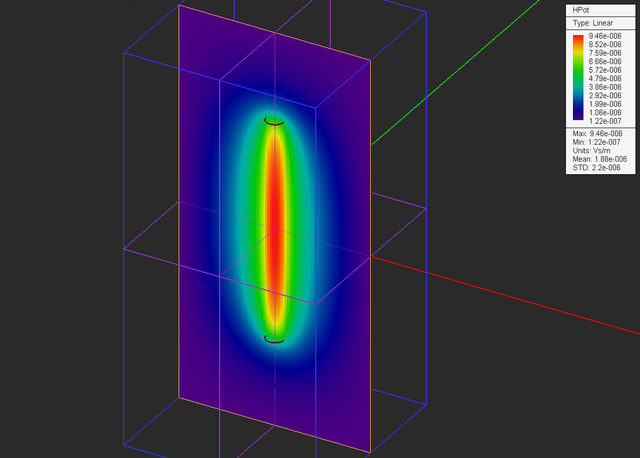
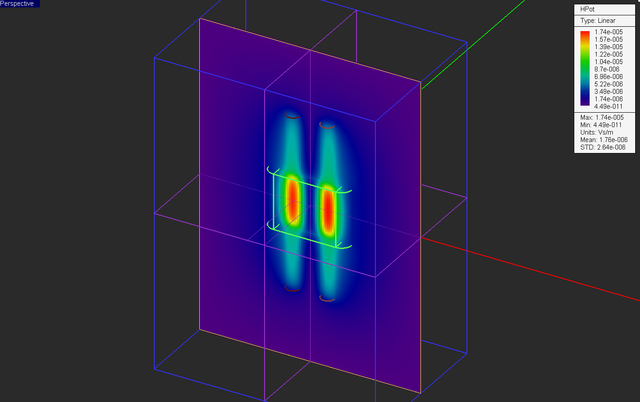
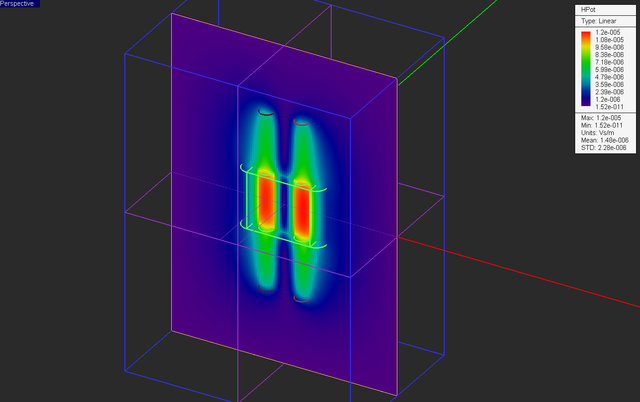
At the end of the magnetostatic simulation, visualize the field sensor plots. Note that the electric field components and electric potential are all zero. The top vector plot shown below clearly illustrates the rotational nature of the magnetic field of a linear current and verifies the famous right-hand rule.
Verifying Your Magnetostatic Simulation Results
Consider an infinitely long vertical cylindrical current of radius a and a uniform current density [math]\mathbf{J(r)} = J_0 \mathbf{\hat{z}}[/math]. Due to the symmetry of the cylindrical current, you would expect the magnetic field to be circumferential (azimuthal) and uniform at all spherical observation angles. In other words,
[math] \mathbf{H(r)} = H_{\phi}(r) \bf{\hat{\phi}} [/math]
Applying Ampere's law on a circular loop of radius r around the current column, one can write:
[math] \oint_{C} \mathbf{H(r)} . \mathbf{dl} = \int\int_{S} \mathbf{J(r)} . \mathbf{ds}= I_{tot} [/math]
or
[math] H_{\phi}(r) \left( 2\pi r \right) = J_0 \left( \pi \rho^2 \right) [/math]
where ρ = r if r ≤ a and ρ = a if r > a. Then, one can derive the following relationships for the magnetic field of an infinitely long uniform cylindrical current distribution:
[math] H_{\phi}(r) = \frac{1}{2}J_0 r, \ \ \ \ \ \ \ r\le a [/math]
[math] H_{\phi}(r) = \frac{I_0}{2\pi r}, \ \ \ \ \ r\gt a [/math]
where I0 = Itot = πr2J0 is the total current flowing through the cylinder. For your cylindrical object, I0 = π(0.002)2(102) = 12.566A. At two distance of r = 2mm and r = 10mm from the cylinder's axis, you will find:
[math] H_{\phi}(r = 0.002m) = (0.5)(10^6)(0.002m) = 1000A/m [/math]
[math] H_{\phi}(r = 0.01m) = \frac{12.566A}{(2\pi)(0.01m)} = 200A/m [/math]
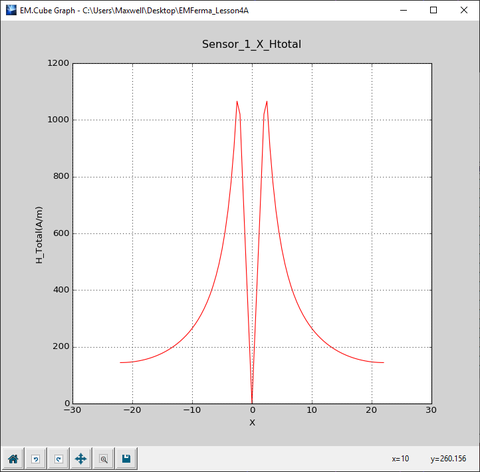
Next, open the Data manager and plot the data file “Sensor_1_X_HTotal.DAT”. As you can see from the figure below, for 0 < r ≤ a = 2mm, the field varies linearly with the distance, while for r > a, it drops as 1/r.
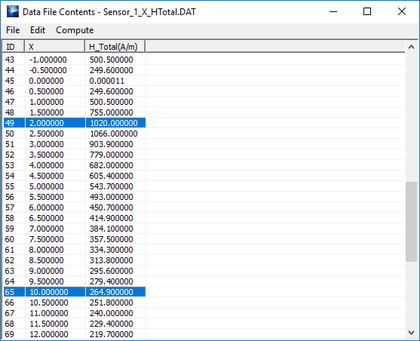
Open the data file “Sensor_1_X_HTotal.DAT” in the data manager's spreadsheet and view its contents. The computed total magnetic field values at r = 2mm and r = 10mm are 1020A/m and 264A/m, respectively. The simulated field value at r = 10mm is slightly different than the theoretical value because the above analytical derivations were based on the assumption of an infinitely long cylinder. Your cylinder object in this project has a finite length, and the finite edge effects become more pronounced as you move farther away from the cylinder's axis.
Analyzing Two Parallel Line Currents
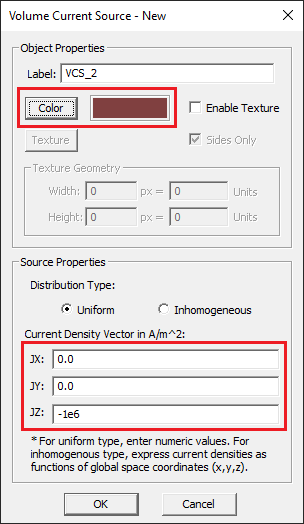
In this part of the tutorial lesson, you will add another current-carrying cylinder to your structure but with its current flowing in the opposite direction. Define a new volume current source group called "VCS_2" with a lighter brown color. Set the values of the components of the current density vector as follows:
| Component | Definition |
|---|---|
| Jx | 0 |
| Jy | 0 |
| Jz | -1e+6 |
With the VCS_2 group active, draw a second upright cylinder according to the table below:
| Part | Object Type | Material Type | Dimensions | Coordinates | Rotation Angles |
|---|---|---|---|---|---|
| Cylinder_2 | Cylinder | VCS_2 | radius = 2mm, height = 50mm | (10mm, 0, -25mm) | (0°, 0°, 0°) |
Keep all the settings from the previous section. But change the location of the vertical "Sensor_2" plane as follows:
| Field Sensor | Direction | Coordinates | Plot Type | Max. Size | Cone Length Ratio | Cone Radius Ratio |
|---|---|---|---|---|---|---|
| Sensor_2 | X | (5mm, 0, 0) | Vector | 2 | 0.25 | 0.25 |
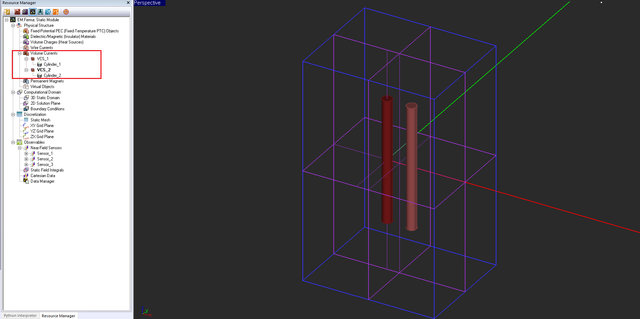
Your physical structure should now look like this:
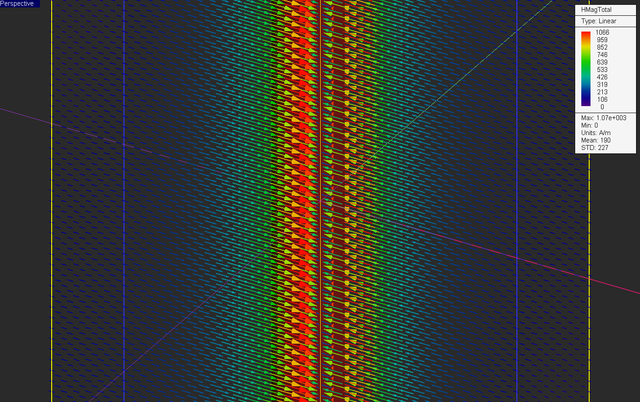
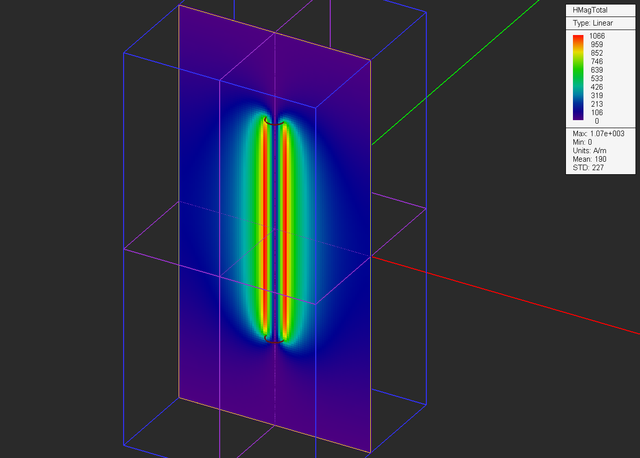
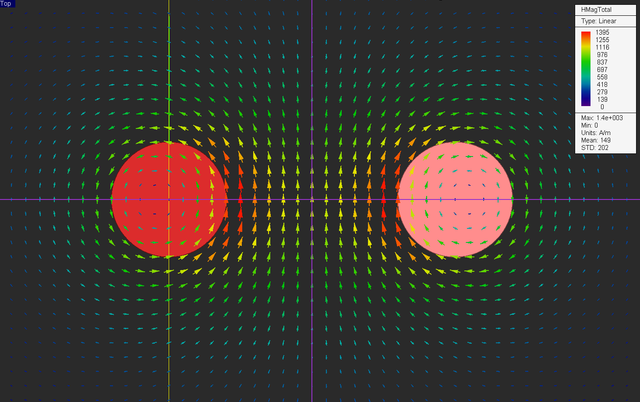
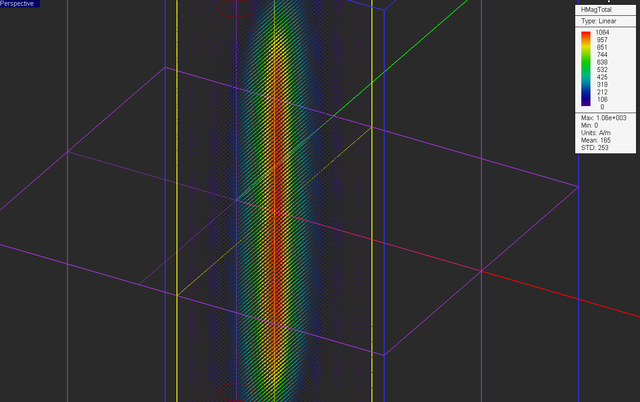
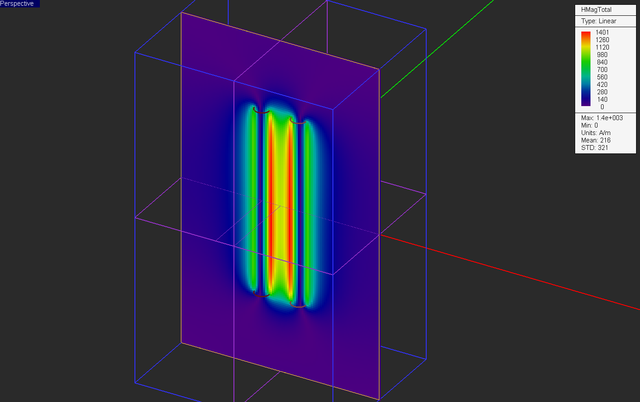
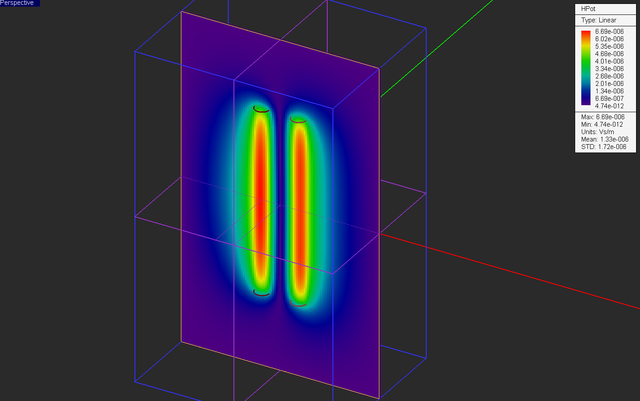
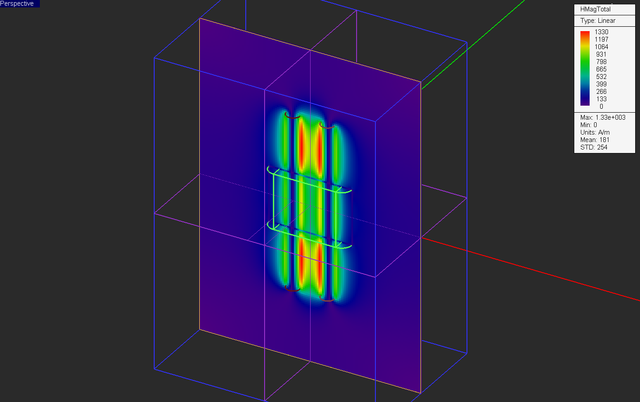
Run a magnetostatic simulation of your structure and visualize the field sensor plots.
Also plot the data file “Sensor_1_X_HTotal.DAT” and compare it to the previous graph of the single current case. Note how the magnetic fields of the two currents add up in the midway vertical plane and create a much higher field intensity on this plane.
Adding a Magnetic Material Part to Your Structure
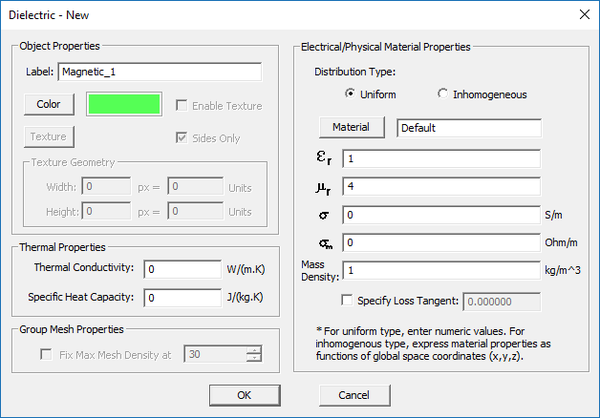
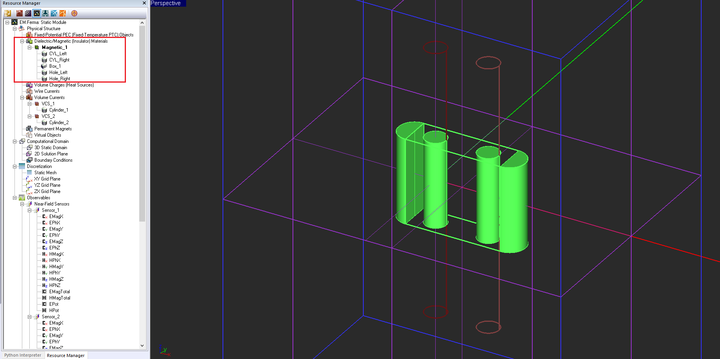
In this part of the tutorial lesson, you will add a fixture made of a magnetic material to hold your current cylinders. In EM.Ferma, dielectric and magnetic materials are lumped together as one category. For a magnetic material, you specify the relative permittivity μr. Define a new magnetic material group called "Magnetic_1" with the default light green and μr = 4.
With the new group "Magnetic_1" active in the navigation tree, draw two cylinders and a box object with the following specifications:
| Part | Object Type | Material Type | Dimensions | Coordinates | Rotation Angles |
|---|---|---|---|---|---|
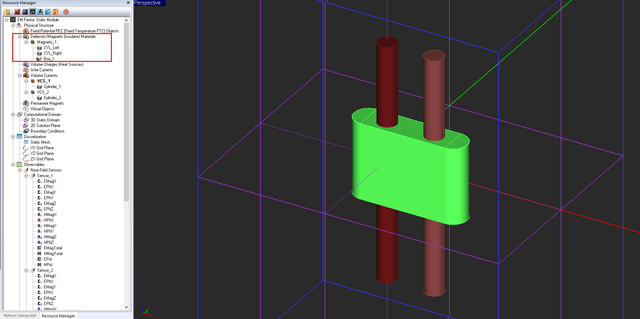
| CYL_Left | Cylinder | Magnetic_1 | radius = 3mm, height = 16mm | (-4mm, 0, -8mm) | (0°, 0°, 0°) |
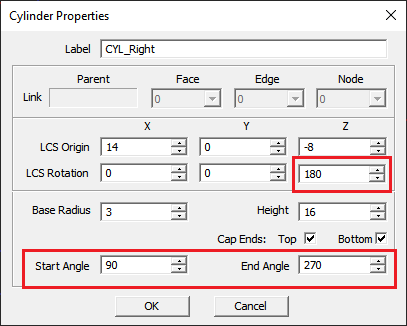
| CYL_Right | Cylinder | Magnetic_1 | radius = 3mm, height = 16mm | (14mm, 0, -8mm) | (0°, 0°, 180°) |
| Box_1 | Box | Magnetic_1 | 18mm × 6mm × 16mm | (5mm, 0, -8mm) | (0°, 0°, 0°) |
Also, in the property dialogs of both cylinder objects "CYL_Left" and "CYL_Right", set the Start Angle to 90° and set the End Angle to 270°. This will turn these objects into half-cylinders. Note the second object has a Z rotation angle of 180°.
Keep all the other settings from the previous part intact including all the field sensor planes. Your physical structure should now look like this:
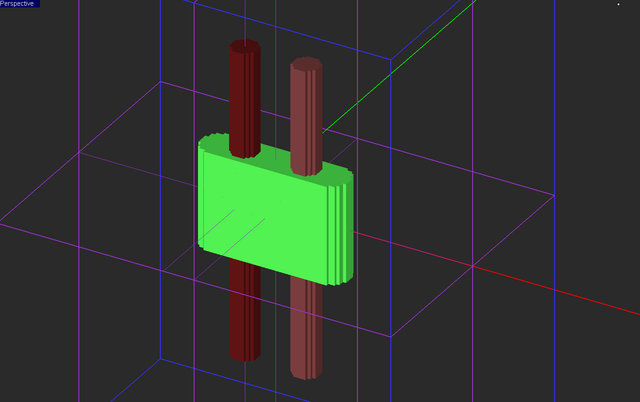
Using the same mesh settings from the previous parts, examine the fixed-cell mesh of your new structure.
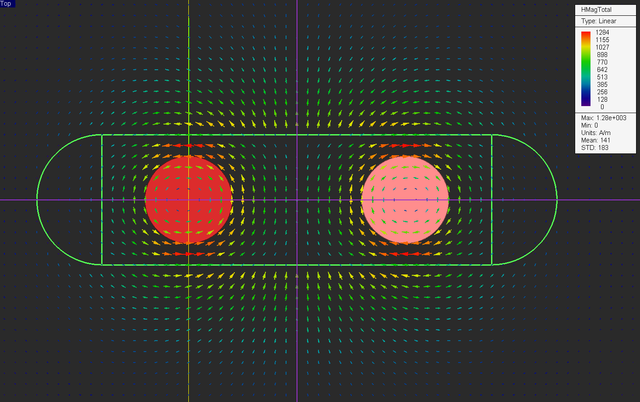
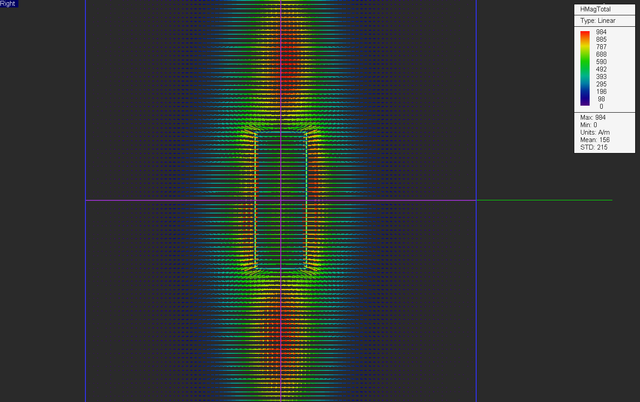
Run a magnetostatic simulation of your structure and visualize the field sensor plots.
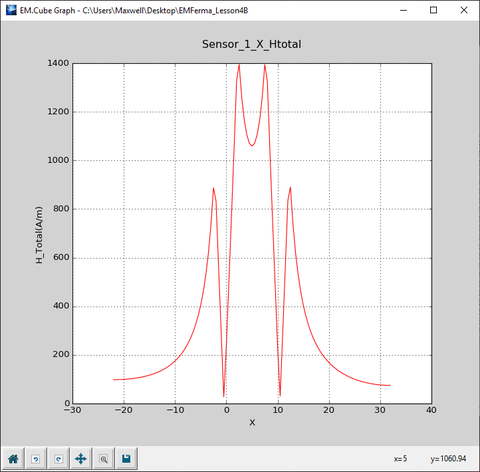
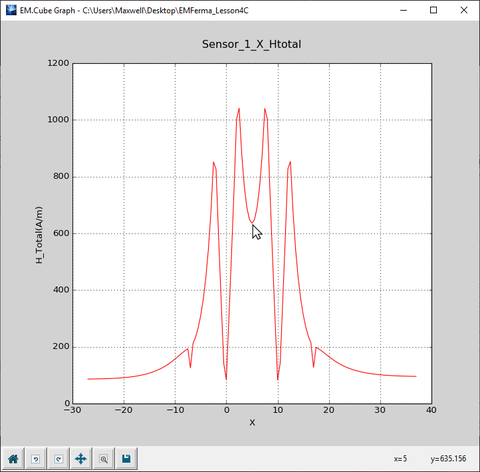
Also plot the data file “Sensor_1_X_HTotal.DAT” and compare it to the previous graph of the case without the magnetic fixture. You can see that the magnetic field intensity at the center of the magnetic material (x = 5) has dropped down to 635A/m compared to the a much higher value of 1060A/m at the same spot in the previous case.
Testing a More Complicated Magnetic Material Part
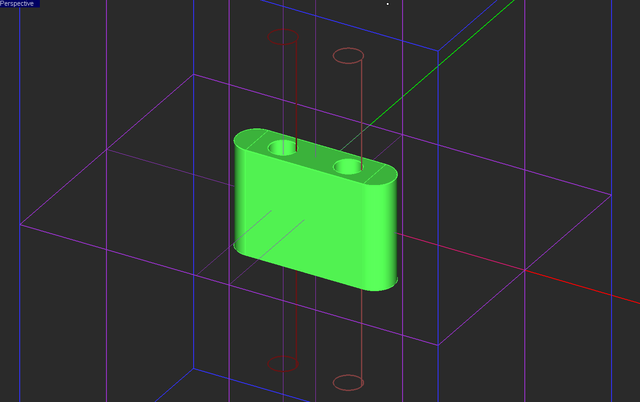
In the structure of the previous part, a large portion of the two current-carrying cylinders overlap with the magnetic material fixture. The cylinders are sources (J) while the magnetic material is characterized by its permeability μ. Therefore, it was assumed that the current J flows in a material medium with the permeability μ = 4μ0 inside the two overlap regions. In the last part of this tutorial lesson, you are going to perforate two cylindrical holes in the magnetic holding fixture with the same radius as the current cylinders. As a result, the currents will flow in their entirety in an non-permeable medium with μ0.
To create the holes, activate the group "Magnetic_1" and draw two new cylinder objects as follows:
| Part | Object Type | Material Type | Dimensions | Coordinates | Rotation Angles |
|---|---|---|---|---|---|
| Hole_Left | Cylinder | Magnetic_1 | radius = 2mm, height = 16mm | (0, 0, -8mm) | (0°, 0°, 0°) |
| Hole_Right | Cylinder | Magnetic_1 | radius = 2mm, height = 16mm | (10mm, 0, -8mm) | (0°, 0°, 0°) |
The new cylinders are completely embedded inside "Box_1". Next, you are going to perform a Boolean subtraction operation. In this operation, you will subtract objects "Hole_Left" and "Hole_right" from the object "Box_1". Click the Subtract ![]() button on the Action Toolbar.
button on the Action Toolbar.
First click either on the surface of "Box_1" or on its name in the navigation tree to select the object to subtract form and press the keyboard's Enter key. Next select the names of "Hole_1" and "Hole_2" from the navigation tree. These are the objects to be subtracted. You can also click on the surface of these objects in the project workspace although it might be harder due to mouse-over conflicts. Since you can select multiple objects for subtraction, you have to press the keyboard's Enter key to signal the completion of the object selection.
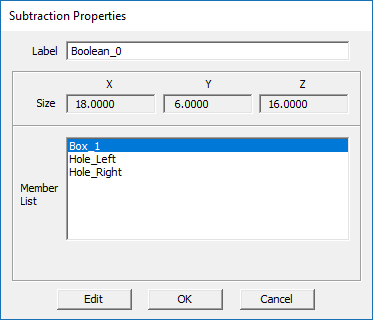
The three objects "Box_1", "Hoe_Left" and "Hole_Right" are deleted from the navigation tree and replaced with a single Boolean object. You can right-click on the surface of the Boolean object or on its name in the navigation tree and open its property dialog from the contextual menu. Note that you can always access the constituent object and edit they individual properties.
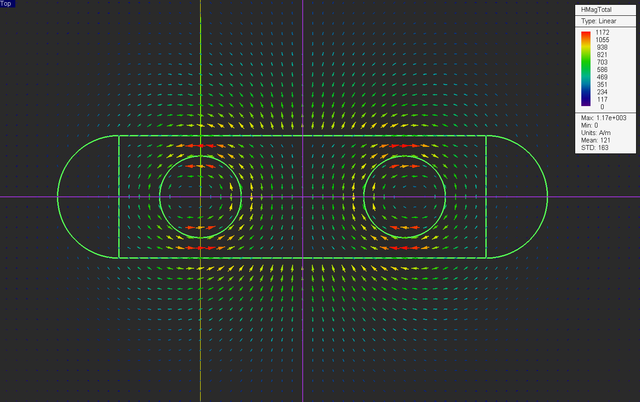
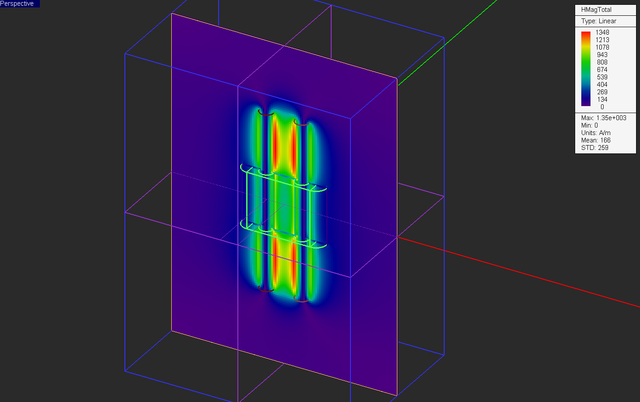
With the Boolean operation completed, run a magnetostatic simulation of your modified structure and visualize the field sensor plots.
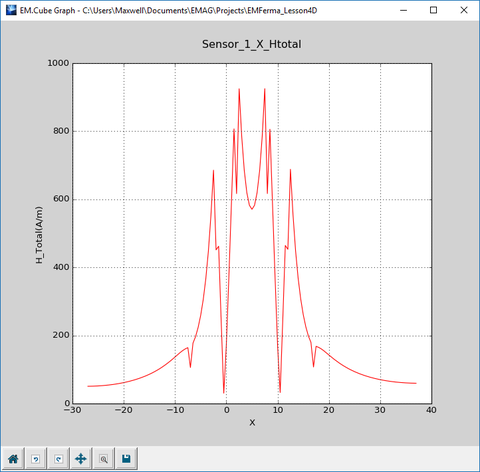
Also plot the data file “Sensor_1_X_HTotal.DAT” and compare it to the previous graph of the case the solid magnetic fixture. Note all the magnetic field discontinuities that occur at the air-material interfaces at x = -7mm, -2mm, 2mm, 8mm, 10mm and 17mm.
