Difference between revisions of "NeoScan for Antenna Characterization"
Kazem Sabet (Talk | contribs) |
|||
| (57 intermediate revisions by 2 users not shown) | |||
| Line 1: | Line 1: | ||
| + | [[File:NeoScan_Product.png|thumb|400px]] | ||
| + | __NOTOC__ | ||
| + | [[Image:Back_icon.png|40px]] '''[[NeoScan| Back to NeoScan Main Page]]''' | ||
| + | |||
== From Near Fields to Far Fields == | == From Near Fields to Far Fields == | ||
| − | |||
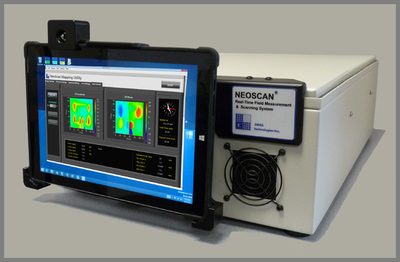
[[NeoScan]] systems can be used as an essential tool for characterization, test and evaluation of antennas and phased array systems. It is a well-established fact that once you have an accurate estimate of the aperture fields, you can compute the far-field radiation patterns of an antenna with reasonable accuracy. This fact is based on the equivalence principle and the Huygens theory in electromagnetics. Time domain electromagnetic simulation tools such as [[EM.Tempo]] use a near-to-far-field transformation based on this principle to compute the far-zone fields of any radiating structure. In general, by far fields we mean the electric fields evaluated in the far zone of a physical structure, which satisfies the following condition: | [[NeoScan]] systems can be used as an essential tool for characterization, test and evaluation of antennas and phased array systems. It is a well-established fact that once you have an accurate estimate of the aperture fields, you can compute the far-field radiation patterns of an antenna with reasonable accuracy. This fact is based on the equivalence principle and the Huygens theory in electromagnetics. Time domain electromagnetic simulation tools such as [[EM.Tempo]] use a near-to-far-field transformation based on this principle to compute the far-zone fields of any radiating structure. In general, by far fields we mean the electric fields evaluated in the far zone of a physical structure, which satisfies the following condition: | ||
| Line 8: | Line 11: | ||
where r is the distance between the observation and source points, λ<sub>0</sub> is the free space wavelength and D is the largest dimension of the radiating structure. | where r is the distance between the observation and source points, λ<sub>0</sub> is the free space wavelength and D is the largest dimension of the radiating structure. | ||
| − | + | <table> | |
| − | + | <tr> | |
| + | <td> | ||
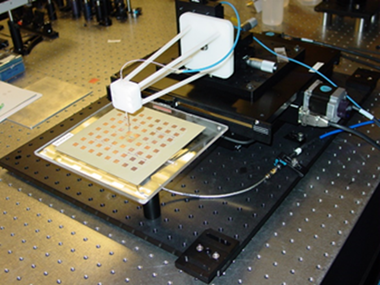
| + | [[Image:NEOWEB11.png|thumb|420px|NeoScan field probe scanning the surface of a microstrip patch antenna at 2.349GHz.]] | ||
| + | </td> | ||
| + | </tr> | ||
| + | </table> | ||
The radiation patterns of antennas and arrays are traditionally measured in anechoic chambers. The size of the chamber, its architecture and the quality of the surrounding absorbers all affect the chamber's frequency range of operation and the accuracy of the measured results. For example, in order to characterize an HF antenna operating at 40MHz, you need a very large and deep anechoic chamber several meters long. Anechoic chamber facilities are very expensive, require a large space and are hard to operate and maintain. Compact ranges are smaller replacements for full-sized chambers. | The radiation patterns of antennas and arrays are traditionally measured in anechoic chambers. The size of the chamber, its architecture and the quality of the surrounding absorbers all affect the chamber's frequency range of operation and the accuracy of the measured results. For example, in order to characterize an HF antenna operating at 40MHz, you need a very large and deep anechoic chamber several meters long. Anechoic chamber facilities are very expensive, require a large space and are hard to operate and maintain. Compact ranges are smaller replacements for full-sized chambers. | ||
| − | Near-field scanning systems are by far the most compact alternatives for antenna pattern measurement. Yet, conventional near-field scanning systems have substantial downsides. These systems involve metallic radiators that act as receivers for picking up the near field of the antenna under test (AUT). Such metallic | + | Near-field scanning systems are by far the most compact alternatives for antenna pattern measurement. Yet, conventional near-field scanning systems have substantial downsides. These systems involve metallic radiators that act as receivers for picking up the near field of the antenna under test (AUT). Such metallic pickup antennas cannot get close to the AUT since they would perturb its near fields. They also limit the operational bandwidth of the system, and their accuracy degrades significantly at lower frequency bands. Sophisticated error correction and compensation algorithms are often used in conjunction with these systems to de-embed and minimize various errors due to their specific architectures and configurations. |
| − | + | ||
== NeoScan vs. Conventional Near-Field Scanning Systems == | == NeoScan vs. Conventional Near-Field Scanning Systems == | ||
| − | + | [[NeoScan]] provides a unique and highly superior alternative to the conventional near-field scanning systems. Some of the very attractive features of the [[NeoScan]] probes are: | |
| − | + | *They are optical by nature. | |
| + | *They provide extremely large bandwidths. | ||
| + | *They have very small footprints. | ||
| + | *They are completely made of dielectric materials and have no metallic parts. | ||
| + | *They are non-invasive and invisible to the radiating antenna. | ||
| + | *They can get very close to the surface of the antenna for diagnostic mapping. | ||
| + | *They can be placed farther from the surface of the antenna for faster near-field scanning for the purpose of far field computation. | ||
| + | *They measure near-fields "As Is" and do not require error correction or compensation. | ||
| − | + | <table> | |
| + | <tr> | ||
| + | <td> | ||
| + | {{#ev:youtube|https://www.youtube.com/watch?v=sjG2aua-4mk|550|left|'''VIDEO''': Characterizing an S-band microstrip-fed patch antenna using NeoScan.|frame}} | ||
| + | </td> | ||
| + | </tr> | ||
| + | </table> | ||
| + | |||
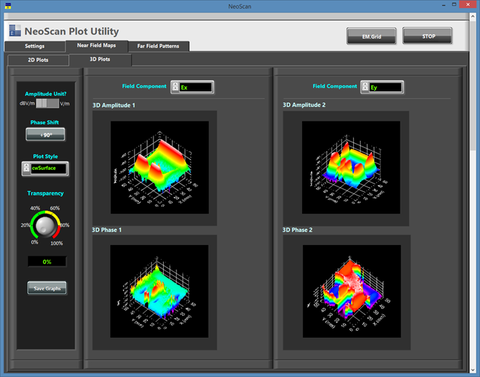
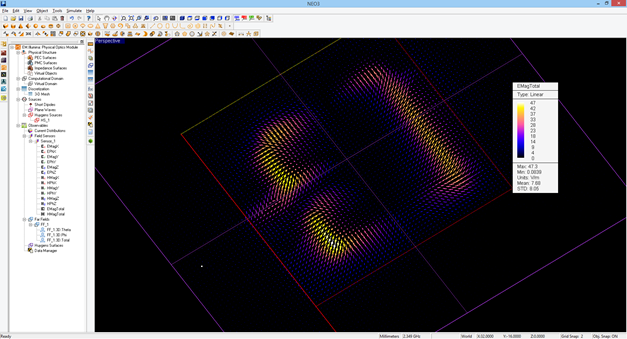
| + | The figures below show the amplitude and phase distribution of the X and Y components the electric field slightly above the surface of the microstrip-fed patch antenna measured at 2.349GHz. Both 2D intensity plots and 3D surface plots are shown. The field amplitude is expressed in dBV/m, while the phase is expressed in degrees. The field scan data can be imported to [[EM.Cube]] with more visualization capabilities. For example, the field components can be combined to produce very informative vector field plots. | ||
| + | To learn more about the details of these patch antenna measurements, check out our web article entitled "'''[http://www.emagtech.com/content/using-emcube-and-neoscan-system-together-antenna-design Using EM.Cube and NeoScan System Together for Antenna Design]'''". | ||
<table> | <table> | ||
<tr> | <tr> | ||
<td> | <td> | ||
| − | [[Image:NEOWEB7.png|thumb| | + | [[Image:NEOWEB7.png|thumb|left|480px|2D intensity plots of the amplitude and phase of the X and Y components of the electric field on the surface of the patch antenna.]] |
</td> | </td> | ||
| + | </tr> | ||
| + | <tr> | ||
<td> | <td> | ||
| − | [[Image:NEOWEB9.png|thumb| | + | [[Image:NEOWEB9.png|thumb|left|480px|3D surface plots of the amplitude and phase of the X and Y components of the electric field on the surface of the patch antenna.]] |
</td> | </td> | ||
</tr> | </tr> | ||
</table> | </table> | ||
| + | <table> | ||
| + | <tr> | ||
| + | <td> | ||
| + | [[Image:NEOWEB41.png|thumb|left|720px|Vector plot of the electric field on the surface of the patch antenna imported to and visualized in EM.Cube.]] | ||
| + | </td> | ||
| + | </tr> | ||
| + | </table> | ||
| − | == A Low-Cost Alternative to Costly Anechoic Chambers | + | == A Low-Cost Alternative to Costly Anechoic Chambers == |
| − | The [[NeoScan]] - ANT system comes with an operational software that quickly determines the optimal | + | The [[NeoScan]]-ANT system configuration comes with an operational software that quickly determines and suggests the optimal parameters for the fastest scan. Based on the physical aperture size, height of the probe above the radiating aperture, and desired angular accuracy, scan parameters such as the total scan area and mechanical step resolution are estimated using the near-field scanning theory. The higher the required field-of-view (FOV) angular accuracy, the larger the scan area. Prior physical knowledge of the radiation characteristics of the antenna under test can help you make more judicious choices for some of these parameters. For example, when scanning a high gain antenna array with very low side lobe levels pointing in the direction of bore sight, you need a smaller FOV angular accuracy. The angular requirements, of course, rapidly begin to change as you steer the beam of a high gain phased array antenna towards grazing angles once undesired grating lobes start to appear. Note that the [[NeoScan]] user can always override all the default or recommended settings and take total control of the operation manually. |
<table> | <table> | ||
<tr> | <tr> | ||
<td> | <td> | ||
| − | [[Image:NEOWEB10.png|thumb| | + | [[Image:NEOWEB10.png|thumb|720px|The Aperture Settings tab of the NeoScan Mapping Utility software.]] |
</td> | </td> | ||
</tr> | </tr> | ||
</table> | </table> | ||
| + | |||
| + | The radiation patterns of the AUT are readily computed using a rigorous near-to-far-field transformation without any need for eliminating artifact errors. The figure below shows the total, theta and phi components of the radiation patterns of the microstrip-fed patch antenna measured at 2.349GHz in the principal E and H planes. Besides the 2D Cartesian and polar radiation pattern graphs, the fully polarimetric 3D far field data of the AUT are generated and saved to an ASCII data file, which can be imported to [[EM.Cube]] for visualization, analysis and other purposes. | ||
<table> | <table> | ||
| Line 61: | Line 95: | ||
</table> | </table> | ||
| − | + | == One System for Both Near & Far Field Characterization == | |
| + | [[NeoScan]]'s non-invasive electro-optic probes have made it possible to directly measure and map the aperture-level fields of a radiating antenna. When dealing with radiating systems, mapping the near fields can have two different purposes. For the purpose of far-field radiation pattern estimation, you don't want to get too close to the surface of the antenna to avoid picking up all the reactive fields and evanescent modes. If you do so, you will need a rather high spatial resolution to capture the field variations with very precise details. On the other hand, for the purpose of diagnostic near-field mapping, you do need a very high spatial resolution and you want to maintain the field probe as close as possible to the surface of the antenna under test. [[NeoScan]] does both jobs for you and meets both sets of requirements with one system and the same probes. | ||
| + | |||
| + | In short, with [[NeoScan]], you get a compact portable self-contained system that characterizes your antenna system from the very near fields to the very far fields without requiring considerable real estate. | ||
| − | = | + | <table> |
| + | <tr> | ||
| + | <td> | ||
| + | {{#ev:youtube|https://www.youtube.com/watch?v=l5KjauYge5o|550|left|<b>VIDEO</b>: Mapping the near-fields of a 64-element X-band patch antenna array with a corporate feed network.|frame}} | ||
| + | </td> | ||
| + | </tr> | ||
| + | </table> | ||
| + | |||
| + | For instance, you can examine the inter-element coupling effects in passive and active phased arrays. The figure below shows a 64-element fixed-beam X-band patch antenna array with an elaborate micostrip corporate feed network operating at 10.65GHz. The array was designed with a uniform amplitude distribution, <i>i.e.</i>, it should supply equal powers to all the 64 patch radiators. | ||
| − | |||
<table> | <table> | ||
<tr> | <tr> | ||
<td> | <td> | ||
| − | [[Image: | + | [[Image:NEOWEB40.png|thumb|left|380px|A 64-element X-band patch antenna array with a corporate feed network operating at 10.65GHz.]] |
| + | </td> | ||
| + | <td> | ||
| + | [[Image:NEOWEB43.png|thumb|left|340px|A high-resolution field map of a quarter of the 64-element X-band patch antenna array.]] | ||
</td> | </td> | ||
</tr> | </tr> | ||
</table> | </table> | ||
| + | |||
| + | As the video shows, the low-resolution near-field maps at a higher height above the array surface provide a good estimate of the far-field radiation patterns, but they do not reveal much about the field distribution of the individual radiating elements. To accomplish the latter, you have to bring the probe down much closer to the radiating aperture. From the figures below, you can easily see that a large portion of the supplied RF power is trapped in the feeding transmission lines, and some patch elements receive much lower power levels than the others. | ||
<table> | <table> | ||
<tr> | <tr> | ||
<td> | <td> | ||
| − | [[Image: | + | [[Image:NEOWEB42.png|thumb|left|720px|Low-resolution Ex and Ey field maps of the entire 64-element X-band patch antenna array.]] |
</td> | </td> | ||
| + | </tr> | ||
| + | <tr> | ||
<td> | <td> | ||
| − | [[Image: | + | [[Image:NEOWEB44.png|thumb|left|720px|Radiation pattern graphs of the 64-element X-band patch antenna array in the principal E and H planes.]] |
</td> | </td> | ||
</tr> | </tr> | ||
</table> | </table> | ||
| − | == | + | == A Perfect Solution for Characterizing Ultra-wideband Antenna Systems == |
| − | + | Far-field characterization of ultra-wideband antenna systems is a very challenging task. Whether you use an anechoic chamber or a conventional near-field scanning system for this task, you have to utilize different types of metallic antennas with different sizes at different frequency bands in both cases. [[NeoScan]] is inherently an ultra-wideband field measurement system. Its EO field probes have cutoff frequencies well within the terahertz region. It is primarily the RF processing back end of [[NeoScan]] that currently limits its operational bandwidth. | |
| − | + | <table> | |
| + | <tr> | ||
| + | <td> | ||
| + | [[Image:NEOWEB28.png|thumb|left|420px|Measuring the fields at the aperture of an ultra-wideband ridge horn antenna at 5GHz.]] | ||
| + | </td> | ||
| + | </tr> | ||
| + | </table> | ||
| + | |||
| + | [[NeoScan]] field probes can measure the aperture field distribution of a wideband antenna over a very large frequency range. However, far-field radiation patterns are frequency domain data by nature. They are measured and visualized at a specified frequency. Several radiation pattern plots are typically generated at different frequency bands to characterize an ultra-wideband antenna system. Using a [[NeoScan]] system for this purpose provides the ultimate convenience of using the same measurement setup, the same AUT positioning and the same field probes to perform near-field scanning at multiple frequency bands. All you need to do is vary the frequency of the RF signal generator that feed the antenna under test. | ||
<table> | <table> | ||
<tr> | <tr> | ||
<td> | <td> | ||
| − | [[Image: | + | [[Image:NEOWEB29.png|thumb|left|375px|The aperture field distribution of the ridge horn antenna.]] |
| + | </td> | ||
| + | <td> | ||
| + | [[Image:NEOWEB30.png|thumb|left|345px|The far-field radiation pattern of the ridge horn antenna.]] | ||
</td> | </td> | ||
</tr> | </tr> | ||
</table> | </table> | ||
| + | |||
| + | == A Perfect Solution for Characterizing High-Power Antenna Systems == | ||
| + | |||
| + | Test and evaluation of high-power antenna systems or active phased arrays is a daunting process. Special considerations must be taken into account when measuring high-power radiating systems in an anechoic chamber including operator's safety and fire hazards. The problems are multiplied when using a near-field scanning system whose metallic receiver probe has to be positioned at a far enough distance from the transmitting antenna under test. In contrast, [[NeoScan]] probes can handle field intensities as large as 2MV/m and can even withstand higher radiated power levels. The non-invasive EO probes can be placed very close to the surface of the high-power radiating aperture, while the optical mainframe and RF processing back end reside much farther at a reliable distance from the aperture. | ||
| + | |||
| + | EMAG's unique probe and optical processing technology utilizing polarization maintaining (PM) optical fibers allows standoff distances as long as 50 meters between the probe location at the aperture of the high-power array and the optical mainframe. This enables you to readily characterize very high-power antenna systems very accurately in a totally non-invasive manner without any serious safety or logistic concerns. In other words, you don't need to attenuate or lower the transmitted power levels of your antenna system to meet safety requirements or make it possible for the conventional metallic probes to operate in the proximity of the antenna aperture without interfering with it. With [[NeoScan]], you can characterize your high-power antennas or active phased arrays under their true or nominal operating conditions. | ||
| + | |||
<table> | <table> | ||
<tr> | <tr> | ||
<td> | <td> | ||
| − | + | {{#ev:youtube|https://www.youtube.com/watch?v=oAa-XqE9H1g|550|left|<b>VIDEO</b>: Characterizing an X-band slotted waveguide array.| frame}} | |
</td> | </td> | ||
| + | </tr> | ||
| + | </table> | ||
| + | |||
| + | You can use [[NeoScan]] for measurement of different types of antenna structures and array topologies. In certain cases, prior physical knowledge of field distributions may facilitate and expedite the scanning process. For example, the figure below shows an X-band slotted waveguide array operating at 9.42GHz. From the physics of such structures, you know that the fields are highly localized close to the centerline of the waveguide array. In addition, the tangential field component parallel to the direction of the slots is zero. Therefore, if the goal of near-field scanning is to compute the far-field radiation patterns, only one tangential field component needs to be mapped. For a complete near-field characterization, however, you may want to measure the normal field maps, too. | ||
| + | |||
| + | <table> | ||
| + | <tr> | ||
<td> | <td> | ||
| − | [[Image: | + | [[Image:NEOWEB15.png|thumb|left|550px|Measuring the fields at the aperture of an X-band slotted waveguide antenna array at 9.42GHz.]] |
</td> | </td> | ||
</tr> | </tr> | ||
</table> | </table> | ||
| + | |||
| + | <table> | ||
| + | <tr> | ||
| + | <td> | ||
| + | [[Image:NEOWEB8.png|thumb|left|240px|The aperture field distribution of the slotted waveguide array.]] | ||
| + | </td> | ||
| + | <td> | ||
| + | [[Image:NEOWEB16.png|thumb|left|240px|The far-field radiation pattern of the slotted waveguide array.]] | ||
| + | </td> | ||
| + | </tr> | ||
| + | </table> | ||
| + | |||
| + | <br /> | ||
| + | |||
| + | <hr> | ||
| + | |||
[[Image:Back_icon.png|40px]] '''[[NeoScan| Back to NeoScan Main Page]]''' | [[Image:Back_icon.png|40px]] '''[[NeoScan| Back to NeoScan Main Page]]''' | ||
Latest revision as of 20:30, 19 October 2016
From Near Fields to Far Fields
NeoScan systems can be used as an essential tool for characterization, test and evaluation of antennas and phased array systems. It is a well-established fact that once you have an accurate estimate of the aperture fields, you can compute the far-field radiation patterns of an antenna with reasonable accuracy. This fact is based on the equivalence principle and the Huygens theory in electromagnetics. Time domain electromagnetic simulation tools such as EM.Tempo use a near-to-far-field transformation based on this principle to compute the far-zone fields of any radiating structure. In general, by far fields we mean the electric fields evaluated in the far zone of a physical structure, which satisfies the following condition:
- [math]r \lt\lt \frac{2D^2}{\lambda_0}[/math]
where r is the distance between the observation and source points, λ0 is the free space wavelength and D is the largest dimension of the radiating structure.
The radiation patterns of antennas and arrays are traditionally measured in anechoic chambers. The size of the chamber, its architecture and the quality of the surrounding absorbers all affect the chamber's frequency range of operation and the accuracy of the measured results. For example, in order to characterize an HF antenna operating at 40MHz, you need a very large and deep anechoic chamber several meters long. Anechoic chamber facilities are very expensive, require a large space and are hard to operate and maintain. Compact ranges are smaller replacements for full-sized chambers.
Near-field scanning systems are by far the most compact alternatives for antenna pattern measurement. Yet, conventional near-field scanning systems have substantial downsides. These systems involve metallic radiators that act as receivers for picking up the near field of the antenna under test (AUT). Such metallic pickup antennas cannot get close to the AUT since they would perturb its near fields. They also limit the operational bandwidth of the system, and their accuracy degrades significantly at lower frequency bands. Sophisticated error correction and compensation algorithms are often used in conjunction with these systems to de-embed and minimize various errors due to their specific architectures and configurations.
NeoScan vs. Conventional Near-Field Scanning Systems
NeoScan provides a unique and highly superior alternative to the conventional near-field scanning systems. Some of the very attractive features of the NeoScan probes are:
- They are optical by nature.
- They provide extremely large bandwidths.
- They have very small footprints.
- They are completely made of dielectric materials and have no metallic parts.
- They are non-invasive and invisible to the radiating antenna.
- They can get very close to the surface of the antenna for diagnostic mapping.
- They can be placed farther from the surface of the antenna for faster near-field scanning for the purpose of far field computation.
- They measure near-fields "As Is" and do not require error correction or compensation.
The figures below show the amplitude and phase distribution of the X and Y components the electric field slightly above the surface of the microstrip-fed patch antenna measured at 2.349GHz. Both 2D intensity plots and 3D surface plots are shown. The field amplitude is expressed in dBV/m, while the phase is expressed in degrees. The field scan data can be imported to EM.Cube with more visualization capabilities. For example, the field components can be combined to produce very informative vector field plots.
To learn more about the details of these patch antenna measurements, check out our web article entitled "Using EM.Cube and NeoScan System Together for Antenna Design".
A Low-Cost Alternative to Costly Anechoic Chambers
The NeoScan-ANT system configuration comes with an operational software that quickly determines and suggests the optimal parameters for the fastest scan. Based on the physical aperture size, height of the probe above the radiating aperture, and desired angular accuracy, scan parameters such as the total scan area and mechanical step resolution are estimated using the near-field scanning theory. The higher the required field-of-view (FOV) angular accuracy, the larger the scan area. Prior physical knowledge of the radiation characteristics of the antenna under test can help you make more judicious choices for some of these parameters. For example, when scanning a high gain antenna array with very low side lobe levels pointing in the direction of bore sight, you need a smaller FOV angular accuracy. The angular requirements, of course, rapidly begin to change as you steer the beam of a high gain phased array antenna towards grazing angles once undesired grating lobes start to appear. Note that the NeoScan user can always override all the default or recommended settings and take total control of the operation manually.
The radiation patterns of the AUT are readily computed using a rigorous near-to-far-field transformation without any need for eliminating artifact errors. The figure below shows the total, theta and phi components of the radiation patterns of the microstrip-fed patch antenna measured at 2.349GHz in the principal E and H planes. Besides the 2D Cartesian and polar radiation pattern graphs, the fully polarimetric 3D far field data of the AUT are generated and saved to an ASCII data file, which can be imported to EM.Cube for visualization, analysis and other purposes.
One System for Both Near & Far Field Characterization
NeoScan's non-invasive electro-optic probes have made it possible to directly measure and map the aperture-level fields of a radiating antenna. When dealing with radiating systems, mapping the near fields can have two different purposes. For the purpose of far-field radiation pattern estimation, you don't want to get too close to the surface of the antenna to avoid picking up all the reactive fields and evanescent modes. If you do so, you will need a rather high spatial resolution to capture the field variations with very precise details. On the other hand, for the purpose of diagnostic near-field mapping, you do need a very high spatial resolution and you want to maintain the field probe as close as possible to the surface of the antenna under test. NeoScan does both jobs for you and meets both sets of requirements with one system and the same probes.
In short, with NeoScan, you get a compact portable self-contained system that characterizes your antenna system from the very near fields to the very far fields without requiring considerable real estate.
For instance, you can examine the inter-element coupling effects in passive and active phased arrays. The figure below shows a 64-element fixed-beam X-band patch antenna array with an elaborate micostrip corporate feed network operating at 10.65GHz. The array was designed with a uniform amplitude distribution, i.e., it should supply equal powers to all the 64 patch radiators.
As the video shows, the low-resolution near-field maps at a higher height above the array surface provide a good estimate of the far-field radiation patterns, but they do not reveal much about the field distribution of the individual radiating elements. To accomplish the latter, you have to bring the probe down much closer to the radiating aperture. From the figures below, you can easily see that a large portion of the supplied RF power is trapped in the feeding transmission lines, and some patch elements receive much lower power levels than the others.
A Perfect Solution for Characterizing Ultra-wideband Antenna Systems
Far-field characterization of ultra-wideband antenna systems is a very challenging task. Whether you use an anechoic chamber or a conventional near-field scanning system for this task, you have to utilize different types of metallic antennas with different sizes at different frequency bands in both cases. NeoScan is inherently an ultra-wideband field measurement system. Its EO field probes have cutoff frequencies well within the terahertz region. It is primarily the RF processing back end of NeoScan that currently limits its operational bandwidth.
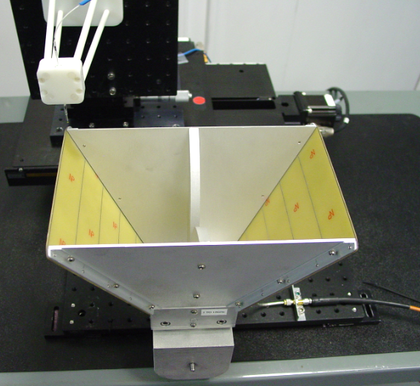
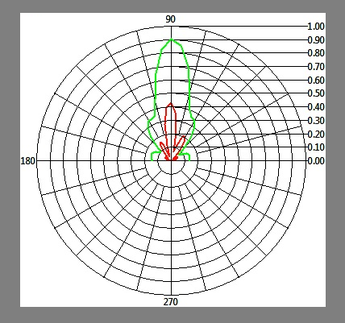
NeoScan field probes can measure the aperture field distribution of a wideband antenna over a very large frequency range. However, far-field radiation patterns are frequency domain data by nature. They are measured and visualized at a specified frequency. Several radiation pattern plots are typically generated at different frequency bands to characterize an ultra-wideband antenna system. Using a NeoScan system for this purpose provides the ultimate convenience of using the same measurement setup, the same AUT positioning and the same field probes to perform near-field scanning at multiple frequency bands. All you need to do is vary the frequency of the RF signal generator that feed the antenna under test.
A Perfect Solution for Characterizing High-Power Antenna Systems
Test and evaluation of high-power antenna systems or active phased arrays is a daunting process. Special considerations must be taken into account when measuring high-power radiating systems in an anechoic chamber including operator's safety and fire hazards. The problems are multiplied when using a near-field scanning system whose metallic receiver probe has to be positioned at a far enough distance from the transmitting antenna under test. In contrast, NeoScan probes can handle field intensities as large as 2MV/m and can even withstand higher radiated power levels. The non-invasive EO probes can be placed very close to the surface of the high-power radiating aperture, while the optical mainframe and RF processing back end reside much farther at a reliable distance from the aperture.
EMAG's unique probe and optical processing technology utilizing polarization maintaining (PM) optical fibers allows standoff distances as long as 50 meters between the probe location at the aperture of the high-power array and the optical mainframe. This enables you to readily characterize very high-power antenna systems very accurately in a totally non-invasive manner without any serious safety or logistic concerns. In other words, you don't need to attenuate or lower the transmitted power levels of your antenna system to meet safety requirements or make it possible for the conventional metallic probes to operate in the proximity of the antenna aperture without interfering with it. With NeoScan, you can characterize your high-power antennas or active phased arrays under their true or nominal operating conditions.
You can use NeoScan for measurement of different types of antenna structures and array topologies. In certain cases, prior physical knowledge of field distributions may facilitate and expedite the scanning process. For example, the figure below shows an X-band slotted waveguide array operating at 9.42GHz. From the physics of such structures, you know that the fields are highly localized close to the centerline of the waveguide array. In addition, the tangential field component parallel to the direction of the slots is zero. Therefore, if the goal of near-field scanning is to compute the far-field radiation patterns, only one tangential field component needs to be mapped. For a complete near-field characterization, however, you may want to measure the normal field maps, too.
