Performing Live Simulations with Circuit Animation or Virtual Instruments
![]() Back to RF.Spice A/D Wiki Gateway
Back to RF.Spice A/D Wiki Gateway
Contents
- 1 Running RF.Spice A/D Live Simulations
- 2 Setting the Input of a Live Simulation
- 3 Setting the Output of a Live Simulation
- 4 Observing Simulation Results Through Circuit Animation
- 5 Using Virtual Instruments
- 6 Virtual Voltmeter
- 7 Virtual Ammeter
- 8 Virtual Wattmeter
- 9 Virtual Power Supply
- 10 Virtual Function Generator
- 11 Virtual Oscilloscope
- 12 Virtual Gain Meter
- 13 Virtual Distortion Meter
- 14 Virtual Bode Plotter
- 15 Virtual Transient Signal Recorder
Running RF.Spice A/D Live Simulations
You can start a live time domain simulation of your circuit simply by pressing the green RUN ![]() button in the Main Toolbar. But getting meaningful results requires a few more steps. A simulation needs an input such as a source as well as a probe or some kind of virtual instrument to measure the result. Inputs can be source devices found in the supplied parts database. These include voltage sources or current sources that supply power to your circuit. Alternatively, you can use the Power Supply or Function Generator in the Virtual Instruments panel to set up stimuli. To measure the results, you can use the Virtual Oscilloscope, Voltmeter, Ammeter or one of the other meters found in the Virtual Instruments or you can use circuit animation, whereby the computed data are displayed and updated on your schematic.
button in the Main Toolbar. But getting meaningful results requires a few more steps. A simulation needs an input such as a source as well as a probe or some kind of virtual instrument to measure the result. Inputs can be source devices found in the supplied parts database. These include voltage sources or current sources that supply power to your circuit. Alternatively, you can use the Power Supply or Function Generator in the Virtual Instruments panel to set up stimuli. To measure the results, you can use the Virtual Oscilloscope, Voltmeter, Ammeter or one of the other meters found in the Virtual Instruments or you can use circuit animation, whereby the computed data are displayed and updated on your schematic.
Set up the appropriate stimulus and meter, set the time step you desire and click the green RUN ![]() button to start the simulation. Click the Pause
button to start the simulation. Click the Pause ![]() button in the toolbar to pause the simulation. Click the green arrow
button in the toolbar to pause the simulation. Click the green arrow ![]() again to resume the simulation or click the Strop/Reset
again to resume the simulation or click the Strop/Reset ![]() button to reset the time to t = 0. The current time is displayed in the simulation toolbar next to the control buttons. The simulation mode is controlled by the main toolbar and consists of the Reset, Pause, Step, Walk, and Run buttons. These buttons control the progress of operation of the live simulation. The Step Ceiling and Update Interval settings control how the simulation progresses and how often the results are updated. The Step button increments the simulation time by one time step and pauses. Each subsequent click of the Step button increments the simulation by another time step. The Walk button starts the simulation but increases the simulation time by the walk factor, which can be set in the Simulation | Time Options menu.
button to reset the time to t = 0. The current time is displayed in the simulation toolbar next to the control buttons. The simulation mode is controlled by the main toolbar and consists of the Reset, Pause, Step, Walk, and Run buttons. These buttons control the progress of operation of the live simulation. The Step Ceiling and Update Interval settings control how the simulation progresses and how often the results are updated. The Step button increments the simulation time by one time step and pauses. Each subsequent click of the Step button increments the simulation by another time step. The Walk button starts the simulation but increases the simulation time by the walk factor, which can be set in the Simulation | Time Options menu.
A live simulation runs a perpetual transient simulation of your circuit starting at time t = 0 and increments the time by the Step Ceiling setting. Results of the simulation are displayed in either the animated schematics or any of the virtual instruments. The results are refreshed by the time specified in the Update Interval setting.
Setting the Input of a Live Simulation
RF.Spice A/D allows both analog and digital stimuli for live simulations. For analog stimuli, you can use the voltage and current sources or the Function Generator or Power Supply in the Virtual Instruments panel. For a digital stimulus, you can use a digital input or a digital source. Note that when you place a voltage or current source in a circuit, Workshop automatically adds a corresponding Function Generator for you. The voltage and current source's transient properties can be set in the transient page of their property dialogs. This allows a variety waveforms including sinusoidal, triangular, square, exponential, piecewise linear, etc.
Setting the Output of a Live Simulation
The voltmeter, ammeter, and markers all can be used to probe voltages and currents for all simulations. In order to use the marker as a voltage probe, check the checkbox by that name in its property dialog. You can also probe the circuit using the virtual instruments such as the oscilloscope, voltmeter, ammeter, wattmeter, etc. Note that virtual voltmeters and ammeters are added to the virtual instrument panel automatically every time you place a voltmeter or ammeter in your schematic. The voltage across the voltmeter, the current through each ammeter, and the voltage at each marker will show up in the various Virtual Instruments depending on their transient or frequency requirements. For more information, refer to the virtual instruments section. You can also display the results of a live simulation using Circuit Animation. In that case, the voltage, current or power data appear on the schematic next to the nodes, wires or devices either as text or graphically as colored wires.
Observing Simulation Results Through Circuit Animation
When you run a live simulation in RF.Spice A/D, you can view the simulation results in real time as the simulation proceeds. In an analog circuit, you are interested in node voltages, branch currents and device powers. In a digital circuit, you are interested in the binary state of wires and device pins. RF.Spice A/D provides several different ways of live data visualization. For analog and mixed-mode circuits, the easiest way is to initiate one or more virtual instruments like voltmeter, ammeter, wattmeter, oscilloscope, etc. These instruments display voltages, currents and powers in real time while a simulation is running. For digital circuits, you can turn on the live digital timing diagrams and observe the binary states of the digital inputs and outputs at each time step.
Besides virtual instruments and live digital timing diagrams, RF.Spice A/D also provides "Circuit Animation". When circuit animation is enabled, little movable text boxes appear on the nodes and wires of your schematic. For analog and mixed-mode circuits, the changing text boxes display various voltage, current, or power values on the nodes and wires. For digital circuits, they display the binary states (0 or 1, or L or H) of various pins or wires. Your circuit can also be animated through wire colors. Positive or high-value quantities turn the color of a wire to red, and negative or low-value quantities turn the color to blue. Black wires represent an intermediate-value or zero quantity. During a live simulation, wires will change colors and arrows and diamonds will indicate the relative strength and flow of the wire currents. In digital circuits, red represents 1 (H) and blue represents 0 (L).
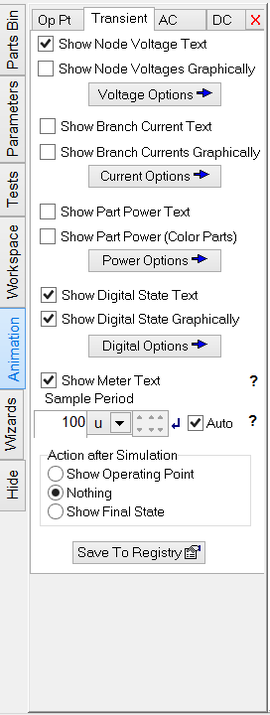
There are two ways to activate and control circuit animation. The first is from the "Animation" tab of the Toolbox. The Circuit Animation Panel has two sets of tabs. The first set features four tabs: Op Pt, Transient, DC and AC. The second set features four tabs: Voltage, Current, Power and Digital. You can have different circuit animation settings for different test types. The Transient tab applies to both Transient Test and live simulations. When you change the circuit in a way that will change the node voltages, the operating point is then recalculated in the background, and the values are re-displayed. You can enable or disable text and graphical animation separately. You can access the second set of tabs by clicking on one of the buttons labeled Voltage Options, Current Options, Power Options or Digital Options. From these tabs, you can further customize the type and format of the quantities you want to display, e.g. instantaneous voltage or current vs. RMS or peak or peak-to-peak values.
For analog and mixed-mode circuits, a simpler way to turn circuit animation on or off is through the Schematic Toolbar. This toolbar features six buttons for "Show Voltage Text", "Show Voltage Graphics", "Show Current Text", "Show Current Graphics", "Show Power Text" and "Show Power Graphics". These button toggle the state of the respective animation mode. Note that the digital state animation is controlled from the Toolbox only. By default, the digital states are always animated and the wires are colored during a digital simulation.
Using Virtual Instruments
Virtual instruments are a very useful and important feature of RF.Spice A/D. You can use some instruments as the stimulus or source of your circuits. Some other instruments can be used to monitor the simulation results in real time. Virtual instruments are primarily used in conjunction with RF.Spice A/D live simulations rather than RF.Spice A/D tests. The following sections describe the operation of each virtual instrument. The specific parameters of each instrument are set using its "setup" button. Pressing the “Setup” button toggles the size of the virtual instrument window. Most instruments have two or more tabs in their settings section containing a number of parameters that can be adjusted. When the setup is complete, press the "Setup" button once again to make the instrument only as tall as its title bar.
| |
Virtual instruments are not saved with the schematic, but with the project only. |
Virtual Voltmeter
Purpose: Easy measurement of the voltages present in a circuit.
Procedure: Working backwards works best here.
First click the General tab to set up the voltmeter's nodes. Choose a node to for the positive and negative nodes using the drop down box or by using the "Probe" tool next to the drop down boxes. Using the probe tool and clicking on a node that you would like to measure automatically selects that node in the drop down box. You should also be aware that voltmeter instruments are automatically inserted if you place a voltmeter part in the schematic.
The next option is the voltmeter’s display range. The meter displays its voltage measurements in two ways: text and a moving bar graph. The bar’s length expands and contracts with the voltage being measured, which makes it an analog readout. When the measured voltage exceeds the voltmeter’s range, the bar changes color from its normal blue to red. Pressing the “Auto” button overrides the fixed range and auto adjusts the range to twice the highest voltage reading it sees.
The Functionality tab allows you to select whether voltage signal is a DC or AC one.
If the signal is AC, then choose whether the RMS (Root Mean Square) value should be used or the peak value. Then select the period over which the voltmeter measures.
Virtual Ammeter
Purpose: Easy measurement of current flowing through a part.
Procedure: Press the Setup button to expand the ammeter. First you have to indicate where you want to insert the virtual ammeter. In the General tab, first choose a part from the drop-down list of the parts in your circuit and then choose a pin on that part. The next option is the ammeter’s display range. The meter displays its measurements in two ways: text and a moving bar graph. The bar’s length expands and contracts with the current being measured, which makes it an analog readout. When the measured current exceeds the ammeter’s range, the bar changes color from blue to red. Pressing the “Auto” button overrides the fixed range and auto-adjusts the range to twice the highest current reading it sees. Under the Functionality tab, choose whether the current signal is a DC or AC one. If the signal is AC, then choose whether the RMS (Root Mean Square), Average, Absolute Average, Peak-to-Peak, or Peak values should be displayed. Then select a sample period for the ammeter.
Behind the scenes, the ammeter instrument severs the wire connection to the selected pin and bridges the gap with a SPICE ammeter. Note that a virtual ammeter is automatically inserted into the virtual instruments panel every time you place an ammeter device in your schematic.
Virtual Wattmeter
Purpose: Easy measurement and display of power dissipation by a circuit element.
Energy (power over time) is measured on a watt-hour meter, such as the one that connects each house to the power company’s lines. If we remove time from the equation, we end up with a power meter, as a power meter measures the instantaneous dissipation of power, much in the same way a speedometer measures a car’s instantaneous speed. The measuring of power dissipated in a purely resistive circuit with a DC voltage source is trivial, as power equals voltage against current, P = VI. The math becomes a little trickier with AC-power sources, as the waveform dictates the averaging formula used to find the power dissipated. Circuits containing reactive parts, such as capacitors and inductors, on the other hand, are much more complex to measure.
Pure reactive components dissipate zero power, which makes sense in a DC circuit, as the capacitor passes no DC current and the inductor displaces no voltage. Yet, in an AC circuit, the reactive components “seem” to dissipate power, as current passes through the capacitor and the inductor sees a voltage drop. This counterfeit power is called “reactive power;” it is measured not in Watts, but in VARs (Volt-Amps-Reactive). In contrast, actual power is labeled “true power” or “active power” or “real power;” it is measured in Watts. To this two powers, a third must be added, “apparent power.” Much in the same way as impedance (Z) is the combination of reactance (X) and resistance (R), apparent power is the combination of pure power with VAR. Apparent power is measured in VAs (Volt-Amps) and it’s mathematical formula symbol is “S.” Transformers are rated in VAs. For example, a 100VA transformer might hold a secondary with a 10Vac winding that can sustain 10A of current output, which if attached to a 10-ohm resistor would realize 100 watts of true power (P) and 100 VA of apparent power (S), but zero VAR of reactive power (Q). And if hooked up to a 265µF capacitor, the transformer would realize 0 watts of true power and 100 VA of apparent power and 100 VAR of reactive power. If the 10-ohm resistor and 265µF capacitor were placed in series and hooked up to the transformer’s secondary, the transformer would realize 50 watts of true power and 70.7 VA of apparent power and 50 VAR of reactive power. The power triangle shown below displays the relationships between the three powers. (Note how Pythagoras theorem nicely applies to the values from the previous example and how apparent power will always be equal to or greater than pure power.)
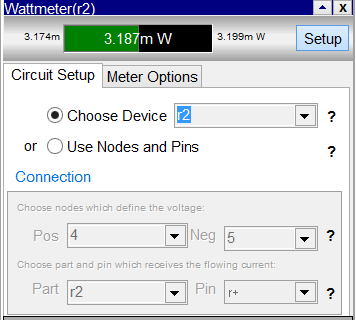
Connecting the power meter to a circuit can be done in two ways in the Circuit Setup tab: by selecting an individual part or by selecting two nodes within the circuit. The Meter Options tab control the display of the meter. The meter displays its measurements in two ways: text and a moving bar graph. The bar’s length expands and contracts with the power being measured, which makes it an analog readout. When the measured current exceeds the power meter’s range, the bar changes color from its normal blue to red. Pressing the “Auto” button overrides the fixed range and auto adjusts the range to twice the highest power reading it sees.
The "Measure Power As" section specifies how the instrument measures Wattage.
Real/Active - In contrast to apparent or reactive power, actual power refers to the power dissipation by resistive components. It is labeled "true power" or "active power" or "real power", and is measured in Watts. Its mathematical formula symbol is "W".
Reactive - Pure reactive components dissipate zero power, which makes sense in a DC circuit, as a capacitor passes no DC current and an inductor displaces no voltage. Yet, in an AC circuit, the reactive components "seem" to dissipate power, as current passes through the capacitor and the inductor sees a voltage drop. This counterfeit power is called "reactive power" and is measured not in Watts, but in VARs (Volt-Amps-Reactive). Its mathematical formula symbol is "Q".
Apparent - Much in the same way as impedance (Z) is the combination of reactance (X) and resistance (R) apparent power is the combination of pure power (P) with reactive power (VAR). Apparent power is measured in VAs (Volt-Amps) and its mathematical formula symbol is "S". Transformers are rated in VAs.
Power Factor - Power Factor (PF) or Total Power Factor (TPF) equals the ration of real power (W), which performs the actual work of creating heat, light, motion, etc., over apparent power (VA) that is the combination of real power (W) and reactive power (VAR).
Virtual Power Supply
Purpose: To provide a quick and convenient means of supplying input voltage to a circuit.
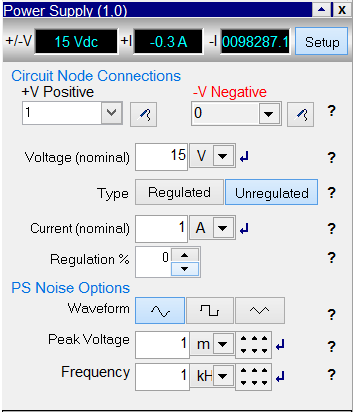
Procedure: Much like an actual bench power supply, the power supply instrument provides a selectable output voltage(s). Both regulated and unregulated power supply types are available and the actual current delivered to the circuit is displayed. Unlike an actual bench regulated power supply, the power supply instrument allows a degraded mode, wherein it functions like an unregulated power supply with ripple on its output, much like an actual raw DC power supply.
The output voltage is set in voltage-selection edit box. If voltage-regulated performance is desired, then select the Regulated button for type. On the other hand, if you wish to simulate a cheap power supply, such as a wallwart, then select Unregulated for type and set the regulation to 25%, the noise to 500mV and the current to the idle current of your circuit. The regulation percentage refers to the over voltage an unregulated power supply develops when unloaded. Thus, a 10-volt/1-amp power supply with 10% regulation will putout 11 volts when it isn’t delivering any current and 10 volts when delivering its rated output current of 1A. 0% regulation means the power supply is indifferent to output current variations, as it produces a constant output voltage. The power supply noise’s frequency equals twice the wall voltage’s frequency, for example, 120 Hz, when the wall voltage is at 60 Hz. The noise’s waveform is selectable. Actual capacitor smoothed power supplies produce a triangular noise waveform; choke input power supplies, something closer to a sine wave waveform; and some switching power supplies, a square wave waveform.
Virtual Function Generator
Purpose: Easy creation of sine, triangle, and square waves to be injected into a circuit.
Procedure: This instrument is functionally equivalent to the SPICE voltage source, but it adds easy frequency and amplitude changes. A node within the circuit must be specified to receive the function generator’s output signal. The reference node is assumed to be the ground. The DC offset of the function generator’s output can be adjusted up and down. You can choose from three waveforms: sinusoidal wave, square wave and triangle wave.
Virtual Oscilloscope
Purpose: To allow you to examine a circuit’s function by displaying voltage over time.
Unlike a gas engine, an electronic circuit’s functioning cannot be gleaned from looking at the circuit board. Yes, the topology might be deciphered, but not the actual functioning of this particular circuit board, as a part might be blown or sitting in a cold-solder joint. With the aid of an oscilloscope, we can see a circuit’s functioning, the actual voltages and currents movements over time.
As a DSO, it has two input traces and an adjustable timebase, trigger source, and vertical signal scaling.
Each channel can be selected and edited by clicking on the Input Trace 1 or Input Trace 2 button in the Traces tab. Selecting a trace allows the signal node, the plot color and width and label to be set. (Plot widths over one pixel slow down the drawing of the waveform.) Additionally, the signal’s gain and vertical and horizontal offsets can be set. Also note that each trace can also be set as DC or AC input mode. This can play an important part in getting a signal to display correctly in the scope. Please see the note at the bottom on the difference between AC and DC mode.
Vertical (Voltage per Division) scaling is set by either pressing the little up and down arrowed buttons or by directly editing the value in the edit box. Capture Extremes will automatically set the vertical min and max settings based on the signal's max and min values. The timebase (Seconds per Division) is set in the same way but can also be set to Auto to allow RF.Spice A/D to automatically select the timebase (x axis). The slider can be used to adjust the x axis division size.
The trigger source can be set to either channel 1 or 2 or another node in the circuit (Ext). The trigger mode can be set to AC or DC, and the triggering level can be adjusted in the Trigger Above and Below boxes. The Trigger Edge selects they how the signal is triggered.
The display can be frozen by pressing the “Run” or "Single", allowing complex waveforms to seen clearly and measured. The Run buttons stops the display at the point the button is pressed. The "Single" button stops the display after one complete drawing of the scope screen. Moving the vertical and horizontal sets of calipers displays the either the vertical voltage or the percentage of the oscilloscope’s left axis and the amount of time or the equivalent frequency implied along the bottom axis. The calipers can be activated in the Vertical and Timebase tabs, for vertical and horizontal calipers respectively.
Pressing the “Setup” button toggles the height of the Small Scope, so that when its setup is complete, the it becomes only as tall as its display band.
- NOTE: There are two modes to the Oscilloscope - AC and DC, both for the Trace Inputs and Trigger setup. DC (Direct Coupled) shows the "real" voltage of the signal, which takes on importance if there is any DC offset. If you select the input mode as AC, a capacitor is inserted in series with the input to block out any DC signal present and pass only AC signals, which will then be centered around 0 volts This is useful if you wish to examine signals showing a small variation around one constant value. In other words, AC mode removes any offset, thus centering the signal around 0V.
This is especially important when dealing with the trigger setup. If a signal had an peak-to-peak voltage of 2V and an offset of 1V, it would be a sine wave centered around 1V. If the trigger mode was set to trigger on a DC rising edge greater than 0, nothing would show up on the scope since in DC mode, the signal's rising edge never gets to rise above 0. If you then changed the trigger mode to AC, THEN the signal would show up on the scope since the signal would then be centered around 0V and the rising edge would trigger the display.
Virtual Gain Meter
Purpose: Easy measurement and display of the relative strength of two (AC or DC) voltages across or inside a circuit in dBs (decibels).
Procedure: Signals often differ by great magnitudes. The miniscule output voltage from a moving-coil phono cartridge (0.1mV) becomes amplified to 1000 volts peak-to-peak at the tube-amplifier’s output tube’s plate. The ratio between these two voltage is 10,000,000. But expressed in dB (decibels), this ratio becomes only 140 dB, a figure that is much more manageable. Aside from compressing large ranges, dBs allow fro easier math. For example, given three identical gain stages that produce a voltage gain of 31.6 times the input, placed in series, what is the total gain? It’s time to find the calculator. But a ratio of 31.6 in dB is 30 dB, which can directly be multiplied by 3 to yield 90 dB of gain; much easier.
Alternatively, a linear display of relative signal strength can be used by pressing the “Linear” button. The display will then show the second signal divided by the first signal.
To measure the ratio between two signals in or through a circuit, the Gain Meter must be attached to two nodes and their references (usually, ground). The gain meter displays its measurements in two ways: text and a moving bar graph. The bar’s length expands and contracts with the ratios/gain being measured, which makes it an analog readout. When the measured signal gain exceeds the gain meter’s range, the bar changes color from blue to red. Pressing the “Auto” button overrides the fixed range and auto adjusts the range to twice the highest distortion reading it sees.
The Functionality tab allows you to select between AC (mediated-coupled), where the meter functions as if it were coupled via a capacitor) or DC (direct coupling), where the meter reads the instantaneous voltage directly without processing. If the signal is AC, then choose whether the RMS (Root Mean Square) value, Average, Absolute Average, Peak-to-Peak, or Peak value should be used.
Virtual Distortion Meter
Purpose: Easy measurement of the distortion generated within a circuit, usually an amplifier, due to nonlinear devices.
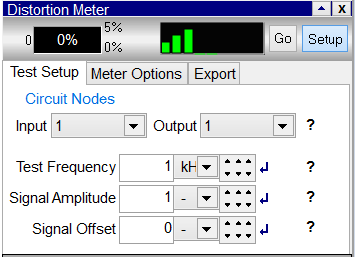
Procedure: First, specify an input and an output node. The distortion meter needs an input to inject a pure signal, against which it will compare the output’s signal. Second, a test frequency needs to be entered (usually 1kHz for audio circuits). You can also set the Amplitude and offset of the test signal. The next option is to specify what the distortion meter should measure. A pure single-tone signal has no harmonics, as it contains only one frequency, whereas an impure signal can hold many frequencies, which are usually integer multiples of the original single frequency. Thus a pure 1kHz signal can gives rise to 2kHz, 3kHz, 4kHz harmonic frequencies. Usually, all the added frequencies are higher than the input signal's fundamental frequency, but not always. Certain digital circuits, for example, can give rise to sub-harmonic signals.
The Total Harmonic Distortion (THD) figure is the sum of all the harmonically related contributions to the signal’s magnitude. Thus, if 0.9 volts of a 1-volt output signal is made up of fundamental frequency and 0.1 volts is made up of the fundamental’s second harmonic frequency, the THD equals 10%. The distortion meter can display THD of a circuit or just one of the first five harmonics. The option to display the results as a percentage or in dBs is quite straightforward. One percent distortion equals the distortion’s contribution to the output signal being –40dB down in amplitude relative to the output signal. The formula is:
DB = 20Log (distortion signal / output signal)
The distortion meter’s display range should be set to the maximum amount of distortion the user is willing to accept. The meter displays its measurements in two ways: text and a moving bar graph. The bar’s length expands and contracts with the distortion being measured, which makes it an analog readout. When the measured current exceeds the distortion meter’s range, the bar changes color from its normal blue to red. Pressing the “Auto” button overrides the fixed range and auto adjusts the range to twice the highest distortion reading it sees. Pressing the “Setup” button toggles the length of the Distortion Meter, so that when its setup is complete, the Distortion Meter becomes only as tall as its display band.
Virtual Bode Plotter
Purpose: Easy measurement of a circuit’s frequency response.
Procedure: This instrument displays its measurements in a small graph. The Input/Output tab allows you to set up the test in regards to the circuit. Under this tab, choose two inout nodes in your circuit or an input part. (Behind the scenes, the frequency sweep instrument adds an AC voltage source to the circuit, or if there is already a voltage source connected to the node and ground, it takes over its settings.) You should also choose two output nodes. Then select a Signal Amplitude and you are ready to run the test.
Set up the sweep for the test under the Sweep tab. Here you can set whether the graph’s display should reflect a logarithmic or linear labeling of frequency. Select a start and stop frequency and the number of steps per interval for the test to run.
Set up the graph under the Graph Settings tab. Here you can control the graph's display of both the amplitude and the phase across the frequency sweep’s range. The Y-axis settings are the maximum and minimum limits of the graphs display, with the option to set the graph display to linear or in dB. Pressing the “Auto” button overrides the fixed Y-axis tick makings and it auto adjusts the graph’s Y-axis limits to twice the highest current reading it sees. The X-axis settings are the beginning and ending frequencies.
The last tab, Export, allows you to export the graph to various formats, including graphic files, text tables, or even copy it to the Project's graph window. You can even copy the graph into memory to paste into other applications.
Press the Amplitude/Phase to switch between the two modes. Press the "Run Sweep" button to proceed with the test. Pressing the “Zoom” button brings up a new window with just the graph portion of the small frequency sweep instrument. Moving the cursor across the graph reveals the frequency and the dB or phase under the cursor.
Virtual Transient Signal Recorder
Purpose: To record up to two signals for either a predetermined period of time or the entire length of the simulation run and save the data to a file.
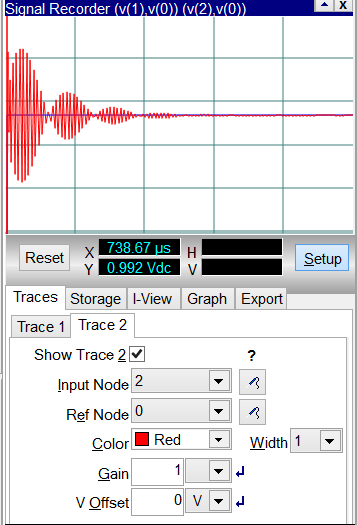
Setting up the Transient Recorder is as simple as specifying the Trace node(s) and reference node(s) and then setting up the capture window.
The Traces tab is where you set up the signal(s) to record. The Traces tab has separate sub-tabs that allow you to set up Trace 1 and Trace 2.
For each trace, make sure that the Show Trace box is checked. By default, Trace 1 is always showing, but if you wish to display Trace 2, you need to check the box. Select an input node and Reference node using the drop down box or using the probe tool v5pics/probe.png, which will allow you to "sample" a node in the circuit and have that node number automatically entered into the respective field. If the circuit's node numbers are not showing, you can display them by clicking on the Show Node Names v5pics/show_node.png button in the toolbar. Additionally, you can select the Gain and Vertical Offset and Width of the trace can be set here. Keep in mind that wider widths can slow down the drawing of the signal and simulation.
The Preset tab sets up the Recorder's capture and display properties.
The most important thing to understand is the difference between the Data Capture Interval and Interactive Viewing Interval. The Data Capture Interval specifies what length of data to save. The Interactive Viewing Interval specifies what the instrument window displays.
The Data Capture's All setting captures and saves the data for the entire length of the simulation run until you stop the simulation. The Most Recent button activates the Duration box and allows you to specify a certain period of data to save. If you specify the most recent 5 seconds to capture, and the simulation runs for 23 seconds, only the data from seconds 18-23 are captured. Everything else is discarded. The Fixed button activates both the Start and Duration boxes and allows you to specify that a certain time interval's data is kept. If you specify a start of 1 second and a duration of 5 seconds, then only the data from seconds 1 to 6 are kept. Note that the Duration is not the same as a stop time. It specifies the LENGTH of time, not a fixed time.
The View settings specify what data to display in the graph window.
Again, the Interactive Viewing settings are independent of the Data Capture settings. The All, Most Recent, and Fixed boxes function like the Data Captures settings, but this only affects the graph display. Note that even data that is not displayed in the graph can be retained for saving to a file. If a Most Recent viewing interval of 50ms is specified and the Data Capture setting is set to All, then only the most recent 50ms of data is shown, but ALL the data is being stored in memory and can be saved to a file.
The Export tab allows you to save the data (specified by the Data Capture Interval setting) to either the clipboard to be pasted into another program or saved directly to a file.
