EM.Libera Tutorial Lesson 3: Analyzing Radiation & Scattering from Curved Wires
Contents
Objective:
To investigate the radiation patterns of small and large circular loop antennas in EM.Cube’s MoM3D Module, then construct a circular loop antenna array, modify its element weights and analyze the array using the Wire MoM solver.
What You Will Learn:
In this tutorial lesson, you will learn how to model curved wires and build array objects. First, you will build a circular loop antenna by polygonizing a circle curve and placing a gap source on the resulting polyline object. Then, you will build an 8-element circular loop antenna array using the Array Tool to clone a parent element. You will also modify the weight distribution properties of a gap source array.
Getting Started
Open the EM.Cube application and switch to MoM3D Module. Start a new project with the following attributes:
- Name: WMOMLesson2
- Length Units: mm
- Frequency Units: GHz
- Center Frequency: 1.0
- Bandwidth: 1.0
In the previous tutorial lesson, it was mentioned that the Wire MoM mesh generator of EM.Cube's MoM3D Module converts curve objects into polylines. For example, if you have a circle curve in the project workspace, it mesh will have the form of a regular polygon, whose side length is determined by the mesh density. In this tutorial lesson, you will place a gap source on a circular loop. Since line gap sources can be placed on line or polyline objects only, you will first convert the circle object into a polyline object using EM.Cube's "Polygonize Tool".
Creating a Circular Loop Object
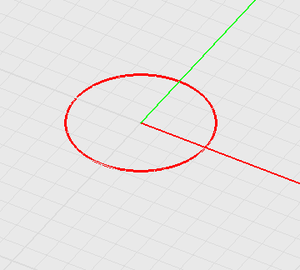
Select the Circular Arc Tool from the Object Toolbar or the menu Object → Curve → Circle. With the circle tool selected, click the origin (0,0,0), and drag the mouse to draw a circle of radius 15 units. Select the circle object by clicking on it and highlighting it in yellow selection color. Now, click the Polygonize Tool ![]() button of the CAD Toolbar or use the keyboard shortcut I. The Polygonize Dialog opens up with the default "Side Count" set to 10. Type in a value of 19 instead and close the dialog. You will see that your circle object is transformed to a polyline object with 19 sides.
button of the CAD Toolbar or use the keyboard shortcut I. The Polygonize Dialog opens up with the default "Side Count" set to 10. Type in a value of 19 instead and close the dialog. You will see that your circle object is transformed to a polyline object with 19 sides.
Source Definition
As mentioned in the previous tutorial lesson, line gap sources can be placed on line and polyline objects only. You will place a gap source on the 10th side of the polyline which is located on the left side of the loop on the X-axis. Right-click on the Gap Source item in the “Sources” section of the Navigation Tree, and select Insert New Line Gap Source… The Line Gap Source Dialog opens up. The drop-down list labeled Line Object displays all the line and polyline objects in the project workspace. In this project, there is only one polyline object, which is selected by default. By default the gap source is placed at the center of the first side of the polyline. From the "Side" drop-down list, select 10. Accept the default offset value which corresponds to the center of the selected side.
Running the Wire MoM Simulation
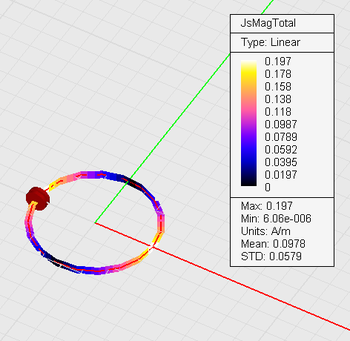
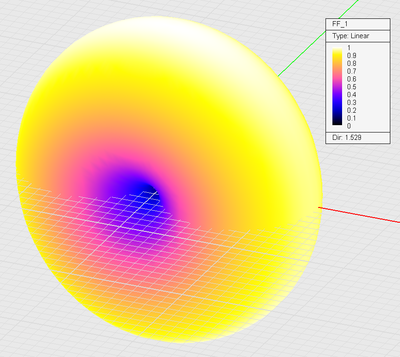
Before running the simulation, open the Mesh Settings dialog and set the mesh "Density" to 30 samples per wavelength. Also, following the same procedure as in the previous tutorial lesson, define a current distribution observable as well as a far field observable with their default settings intact. Click the Run ![]() Button of the Simulate Toolbar to open up the Simulation Run Dialog and click its Run button to start the simulation. After the completion of the simulation, visualize the current distribution and 3D far field radiation plots from the Navigation Tree. As you can see from the figure below, the radiation pattern of a small circular loop looks similar to that of a small dipole antenna.
Button of the Simulate Toolbar to open up the Simulation Run Dialog and click its Run button to start the simulation. After the completion of the simulation, visualize the current distribution and 3D far field radiation plots from the Navigation Tree. As you can see from the figure below, the radiation pattern of a small circular loop looks similar to that of a small dipole antenna.
Increasing the Radius of the Circular Loop
As the next step, repeat the previous part but this time with a circle object of radius 52.52mm. At the operational frequency of 1GHz, the free-space wavelength is λ0 = 300mm. The circumference of the larger circular loop is C = 2πR = 330mm = 1.1λ0. Polygonize the circle object with 19 sides, and define a gap source on the 10th side of the resulting polyline object. Set the mesh "Density" to 30 samples per wavelength, and define a current distribution observable together with a far field observable. Run a single-frequency Wire MoM analysis of the larger circular loop antenna and visualize the simulation results. As you can see from the figures below, the new larger loop supports a large current and provides a larger directivity.
Building an Array Object
Next you will build an 8-element linear array of the large circular loop antenna. If you are continuing and using the same project of the previous part, at this time you need to delete the gap source from the polyline object. To do so, right-click on the gap source's name in the Navigation Tree and select "Delete..." from the contextual menu.
Click on the polyline object to select it. Then click on the Array Tool button of the CAD Toolbar or use the keyboard shortcut A. This opens up the Array Properties Dialog. Set the Element Count to 8 along the X direction and to 1 along the Y and Z directions. Set the Element Spacing to 150mm along the X direction and to 0 along the Y and Z directions. Close the dialog to return to the project workspace. You will see 7 new clones of the original polyline object all lined up along the X-axis. The array elements are placed at a uniform spacing of λ0/2.
Next, define a new gap source. The gap source dialog show a list of all the line or polyline objects as well as all the arrays of line or polyline objects present in the project workspace. Since in this case you have an array of polylines, the gap source dialog allows you to specify the polyline side number to place the gap source on. Like in the previous cases, set the "Side" index to 10. This will create a source array, with 8 gaps located on the 10th side of each of the 8 polyline objects. For source array, you can also specify the weight distribution. By default, all the gap sources have a "Uniform Distribution" with a unit voltage and zero phase. You can choose other distribution types or define a phase progression along one or more principal directions. For this part of the tutorial lesson, keep the default uniform distribution with zero phase progression.
Set the mesh "Density" to 30 samples per wavelength, and define a current distribution observable together with a far field observable. Since the radiation patterns of antenna arrays usually have lots of fine details, you need to set a high angular resolution for this case. If you are using the project from the previous part, open the Radiation Pattern Dialog by right-clicking on the name of the far fields observables FF_1 and selecting "Properties..." from the contextual menu. If you started a new project from the ground up for this part, the Radiation Pattern Dialog opens up when you define a new far field observable. In the "Angle Increments" section of this dialog replace the default 5° values with 1° for both theta and phi spherical observation angles.
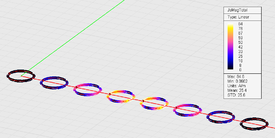
Run a single-frequency Wire MoM analysis of the 8-element loop antenna array with uniform distribution and visualize the simulation results. From the current distribution plot, you can see that the currents are quite similar on all eight array elements as you would naturally expect from a uniform distribution.
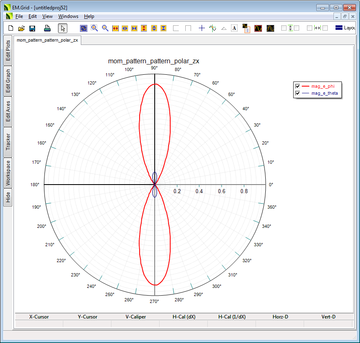
As you can see from the radiation pattern plots below, the array is highly directive in the ZX plane with a directivity of D = 17.17 (≅12.35dB). But the array also features quite large side lobes, which are better visible in the 2D radiation pattern graphs.
Next, you will try a binomial weight distribution for the 8-element loop array. The binomial distribution in known for having no side lobes. Open the gap source property dialog and change the distribution to "Binomial". Run another Wire MoM analysis and visualize the simulation results. For an 8-element array, the binomial distribution is given by the following sequence:
1, 7, 21, 35, 35, 21, 7, 1
As you would expect, the current distribution plot reflects this highly non-uniform excitation on the eight loop element.
The radiation patterns shows a highly directive array with no side lobes. However, this is at the expense of a much reduced: directivity D = 10.26 (≅10.11dB).
Steering the Array Beam
In the last part of this tutorial lesson, you will steer the beam of the last loop array with a binomial distribution by assigning a phase progression to the source array. In order to steer the beam of an antenna array to the spherical angles (θ, φ), a two-dimensional phase progression among the array elements is required along the X and Y directions given by the following equations:
[math]\Psi_x = -\frac{2\pi S_x}{\lambda_0} \sin\theta \cos\phi[/math]
[math]\Psi_y = -\frac{2\pi S_y}{\lambda_0} \sin\theta \sin\phi[/math]
where Sx and Sy are the element spacing along the X and Y directions, respectively. In your project, the loop array is linear (Sy = 0). Therefore, the array beam can be steered only in the ZX plane (φ = 0). Moreover, Sx = λ0/2. The phase progression is therefore given by:
[math]\Psi_x = - \pi \sin\theta [/math]
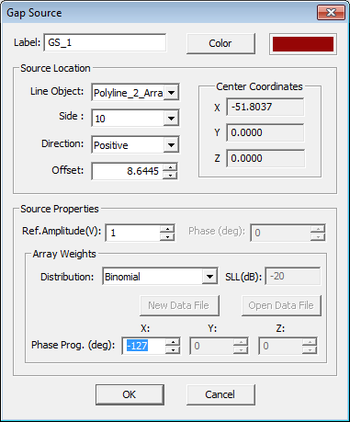
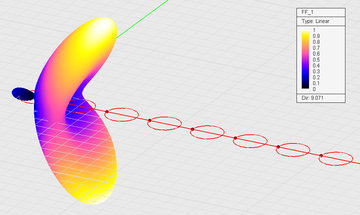
In order to steer the array beam to +45° off zenith, you need a phase progression of -127° along the X direction. Open the property dialog of the gap source array and enter -127 in the box labeled "X Prog. (deg)". Note that the phase progression boxes along the Y and Z directions are already greyed out as your source array is linear (or one-dimensional). Run a Wire MoM analysis of this array and visualize its radiation pattern. As you can see from the figures below, the array beam is titled by 45° off broadside.
Next, change the phase progression along the X direction to 127°. This corresponds to a beam pointing 45° off broadside in the opposite direction, that is in the φ = 180° plane. Run another Wire MoM analysis and verify the results.
