EM.Ferma Tutorial Lesson 4: Examining and Comparing Permanent Magnets and Solenoids
Contents
What You Will Learn
In this tutorial, you will learn how to define and use two more magnetic source types: permanent magnets and wire currents.
Getting Started
Open the EM.Cube application and switch to EM.Ferma. Start a new project with the following attributes:
Creating a Line Object
Create a current source group in the Navigation Tree. Right-click on the Current (Source) item in the Navigation Tree and select Insert New Current Source... from the contextual menu. This opens up the New Current Source Dialog. Accept the default name CS_1, the default orange color and default current value of 1A. Close the dialog to return to the project workspace. With CS_1 group still active, select the Line Tool from the Object Toolbar (or use the keyboard shortcut F3, or the menu Object → Curve → Line).
If you draw a line at this time, it will completely lie in the XY plane, meaning Z = 0 for all the points on the line. For this project, you will draw a vertical line along the Z-axis. To do so, hold the keyboard's Alt Key down, place the mouse cursor at (0, 0, 0) and drag it to draw a vertical line. Set the length of the line to 100 units. When you draw a line as a current source in EM.Cube's Static Module, an arrow is placed at its center pointing in the direction of its local +Z coordinate.
Defining Computational Domain, Mesh & Observables
Open the Domain Settings Dialog, select the "Custom" option for the Domain Type and set the coordinates of the minimum and maximum corners of the domain box to (-50mm, -50mm, -50mm) and (50mm, 50mm, 150mm), respectively. Also, open the Mesh Settings Dialog and set the Number of Cells along the X, Y and Z directions to 50, 50 and 150, respectively. Define two field sensor observables: Sensor_1 located at (0, 0, 50mm) along the Z direction, and Sensor_2 located at (0, 0, 0) along the X direction.
Running the Magnetostatic Simulation and Visualizing the Magnetic Field
At this time, your project is ready for magnetostatic simulation. You do not have to choose the simulation engine type. If the program detects current sources, it will perform a magnetostatic analysis. Click the Run ![]() Button of the Simulate Toolbar to open up the Simultion Run Dialog. Or alternatively, use the keyboard shortcut Ctrl+R, or the menu Simulate → Run… Run a magnetostatic "Analysis" of your structure and view the magnetic field results. Note that in this case the electric field components and electri potential are all zero.
Button of the Simulate Toolbar to open up the Simultion Run Dialog. Or alternatively, use the keyboard shortcut Ctrl+R, or the menu Simulate → Run… Run a magnetostatic "Analysis" of your structure and view the magnetic field results. Note that in this case the electric field components and electri potential are all zero.
You can clearly see the rotational nature of the magnetic field circling around the current-carrying line. The vector plot also asserts the right-hand rule. In order to verify your simulation results, let's consider an infinite vertical current-carrying line along the Z-axis. From Ampere's law, we know that the magnetic field around the line is given by:
[math]H_{\rho}= \frac{I}{2\pi\rho} [/math]
where ρ is the radial coordinate in the cylindrical coordinate system, which is indeed the distance from the vertical axis.
As you saw in Tutorial Lesson 1, besides the color-coded field distribution maps, EM.Cube also generates 2D Cartesian graphs of the total fields along the crosshairs of the field sensor plane. By default, the crosshairs of both Sensor_1 and Sensor_2 are set at X = Y = 0. The 2D graphs are listed in EM.Cube's Data Manager. To open Data Manager, click the Data Manager ![]() button of Simulate Toolbar, or use the keyboard shortcut Ctrl+D, or access the menu Simulate → Data Manager, or right click on the Data Manager item in the “Observables” section of the Navigation Tree and select Open Data Manager…
button of Simulate Toolbar, or use the keyboard shortcut Ctrl+D, or access the menu Simulate → Data Manager, or right click on the Data Manager item in the “Observables” section of the Navigation Tree and select Open Data Manager…
Select the data file “Sensor_1_X_HTotal.DAT” and click the "Plot" button of Data Manager to view its graph in EM.Grid. The graph is shown on the opposite figure. You can enable EM.Grid's "Tracking Crosshairs" to read the coordinates of graph points. This can be done by clicking the toolbar button labeled "Track Selected Plot". The figure shows that at X = 8mm, the total H-field is 19.62 A/m, which agrees well with the above formula:
[math]H_{\rho} (\rho = 0.008m) = \frac{1A}{(2\pi)(0.008m)} = 19.89 A/m [/math]
Note that the infinite line approximation holds well only around the center of the line object, where you have established the Sensor_1 plane. Also keep in mind that at X = 0, the static field experience a field singularity (ρ → 0, 1/ρ → ∞), as is evident from the graph.
Building and Analyzing a Square Loop Current Source
For this part of the tutorial lesson and next one, you can start a new blank EM.Cube project. Follow the same procedure as in the previous part and create a new current source group in the Navigation Tree. Then, select the "Polyline" Tool ![]() from the Object Toolbar and draw a square polyline with the following nodes:
from the Object Toolbar and draw a square polyline with the following nodes:
| Node Index | X | Y | Z |
|---|---|---|---|
| 1 | -25mm | -25mm | 0mm |
| 2 | 25mm | -25mm | 0mm |
| 3 | 25mm | 25mm | 0mm |
| 4 | -25mm | 25mm | 0mm |
You can draw open or closed polyline objects. Each left mouse click creates a new node on the XY plane. You can changes the coordinates of these node later. After you establish the fourth node, type C on your keyboard to close the polyline object. This connects Node 4 to Node 1. Once you complete the drawing process, EM.Cube will place arrow on each side of your polyline object and designate it as a source.
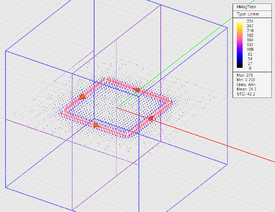
Set up a custom domain box with Min and Max corner coordinates at (-50mm, -50mm, -50mm) and (50mm, 50mm, 50mm), respectively. Set the number of mesh cells along all three X, Y and Z directions to 50. Define two field sensors both located at (0, 0, 0), Sensor_1 along the Z direction and Sensor_2 along the X direction. Run a magnetostatic analysis of your square loop and visualize its magnetic field.
Modeling a Long Solenoid
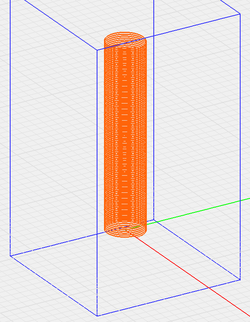
In the last part of this tutorial lesson, you will build a long helix object to model a solenoid. With a current source group already defined and active in the Navigation Tree, select the "Helix" Tool from the Object Toolbar and draw a long helix with the following parameters:
| Helix Parameter | Value |
|---|---|
| Inner Radius | 10mm |
| Outer Radius | 10mm |
| Height | 100mm |
| Number of Turns | 100 |
| |
EM.Cube's Static Module can analyze Line and Polyline current source only. Curves are not allowed. |
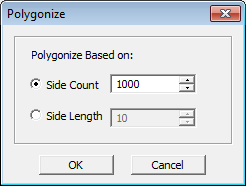
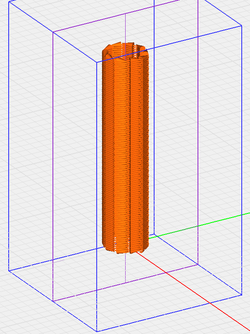
Note that your drawn helix object does not contain any arrows, because it is neither a line, nor a polyline. However, you can convert the helix into a polyline using EM.Cube's "Polygonize" tool ![]() . Select the helix first. Then, click the "Polygonize Tool" button of the CAD Toolbar or use the keyboard shortcut "I". A dialog opens up and asks you for the "Side Count" with a default value of 10. Remember that your helix already has 100 turns. Choose a value of 1000 for the number of sides. This replaces your helix with a very large polyline object in the project workspace. Now you can see the arrows on each side of the polyline object.
. Select the helix first. Then, click the "Polygonize Tool" button of the CAD Toolbar or use the keyboard shortcut "I". A dialog opens up and asks you for the "Side Count" with a default value of 10. Remember that your helix already has 100 turns. Choose a value of 1000 for the number of sides. This replaces your helix with a very large polyline object in the project workspace. Now you can see the arrows on each side of the polyline object.
Set up a custom domain box with Min and Max corner coordinates at (-40mm, -40mm, -20mm) and (40mm, 40mm, 120mm), respectively. Set the number of mesh cells along the X, Y and Z directions to 40, 40 and 60, respectively. Define a field sensors Sensor_1 located at (0, 0, 0) along the X direction. Run a magnetostatic analysis of your solenoid and visualize its magnetic field.
From the figure you can see a very uniform magnetic field in the middle of the solenoid. These results can easily be verified by considering the case of a infinitely long solenoid. Using Ampere's law, one can show that the magnetic field of the solenoid is directed along its axis (Z-axis) and given by:
[math] H_z = N_TI [/math]
where NT is the number of solenoid turns per unit length. You helix object had 100 turns and a height of 100mm. Therefore, NT = 1000 turns/m, and the magnetic field of an infinitely long version of your solenoid is found to be:
[math] H_z (z = 50mm) = (1000)(1A) = 1000 A/m [/math]
Open the Data Manager and plot the data file called “Sensor_1_Z_HTotal.DAT”. From the graph of the total magnetic field vs. Z-coordinate, you can see that field is quite uniform in the middle of the solenoid and has a value of 982A/m, which agrees quite well with the theoretical value for the limiting case.


